Set up the Grafana MCP server (self-hosted)
The Grafana MCP server gives AI agents access to your observability stack — dashboards, Prometheus metrics, Loki logs, Tempo traces, Pyroscope profiles, alerting, incidents, and OnCall. This guide covers creating a Grafana service account token and adding the connector from the MintMCP store.
Use this guide for a Grafana instance you run yourself, including Grafana Cloud instances you want to reach with a service account rather than per-user OAuth. If you are on Grafana Cloud and want each person to authorize with their own account, see Set up the Grafana MCP server instead.
Prerequisites
- A MintMCP admin account
- A Grafana instance, version 9.0 or later
- Permission to create service accounts in Grafana (org admin, or the
serviceaccounts:writepermission)
Two requirements apply:
- Network access: The Grafana instance must be reachable from MintMCP's runtime. Public endpoints work directly. For private or VPN-only instances, allowlist MintMCP's dedicated egress IP on your Grafana server.
- Service account credentials: The connector authenticates with a service account token. API keys are deprecated in Grafana and service account tokens replace them.
Create a service account token
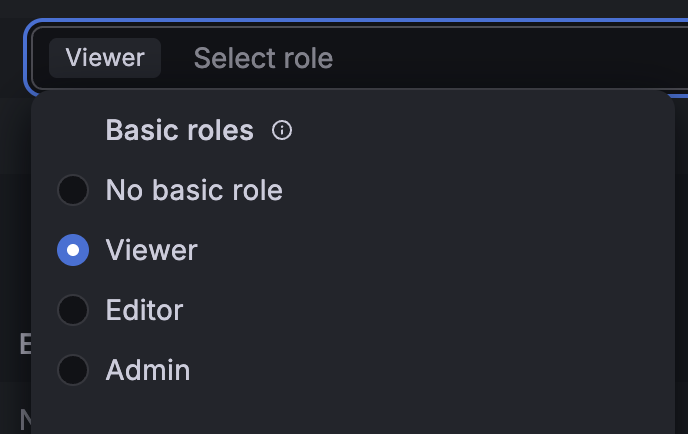
The connector authenticates as one service account shared by everyone who uses it, so scope its role to the least privilege your team needs. Viewer is enough for every read tool — searching dashboards, reading dashboard metadata, checking data source health, and running Prometheus and Loki queries all work on Viewer alone. Editor adds creating and updating dashboards, folders, and annotations, and Admin is only needed for the user and admin tools.
-
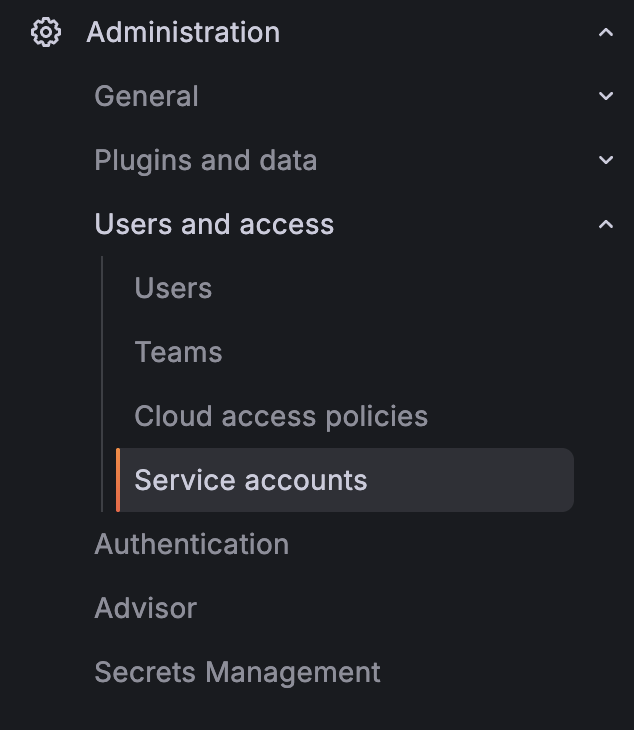
In Grafana, go to Administration > Users and access > Service accounts
-
Click Add service account

-
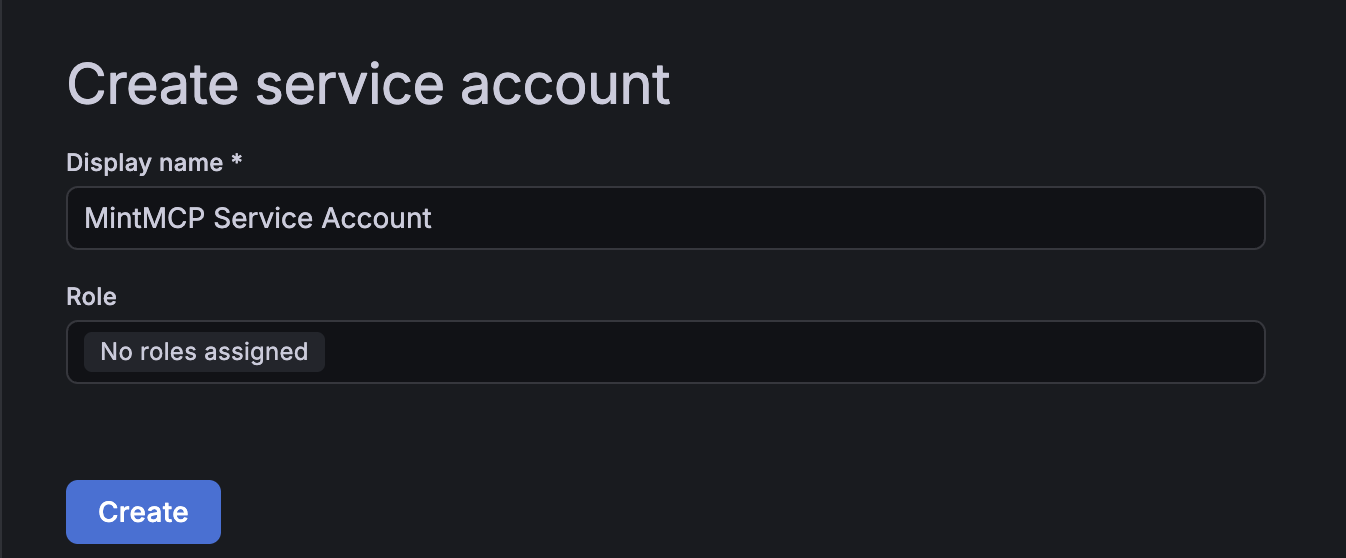
Give it a display name, pick the role, and click Create
The role selector offers the basic roles. Pick Viewer unless your team needs the write tools.
-
On the service account page, click Add service account token

-
Leave the generated name or set your own, choose an expiration, and click Generate token
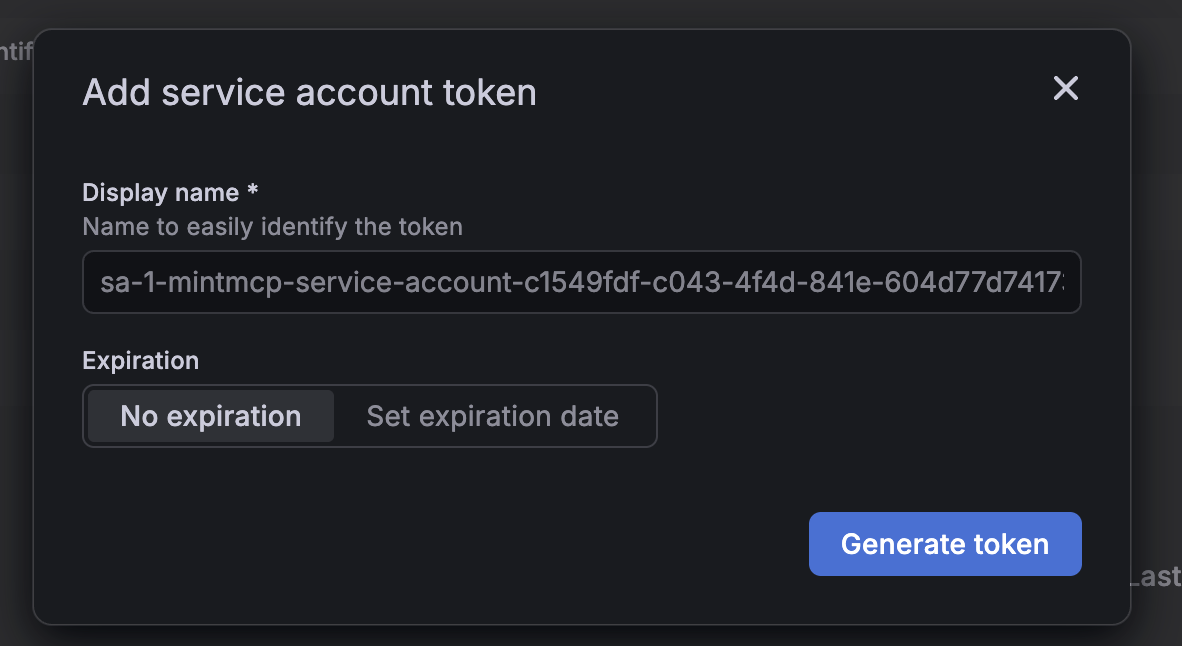
Setting an expiration date bounds the damage from a leaked token, but the connector stops working when it lapses — put the renewal in your calendar if you set one.
-
Copy the token. It starts with
glsa_and is shown only once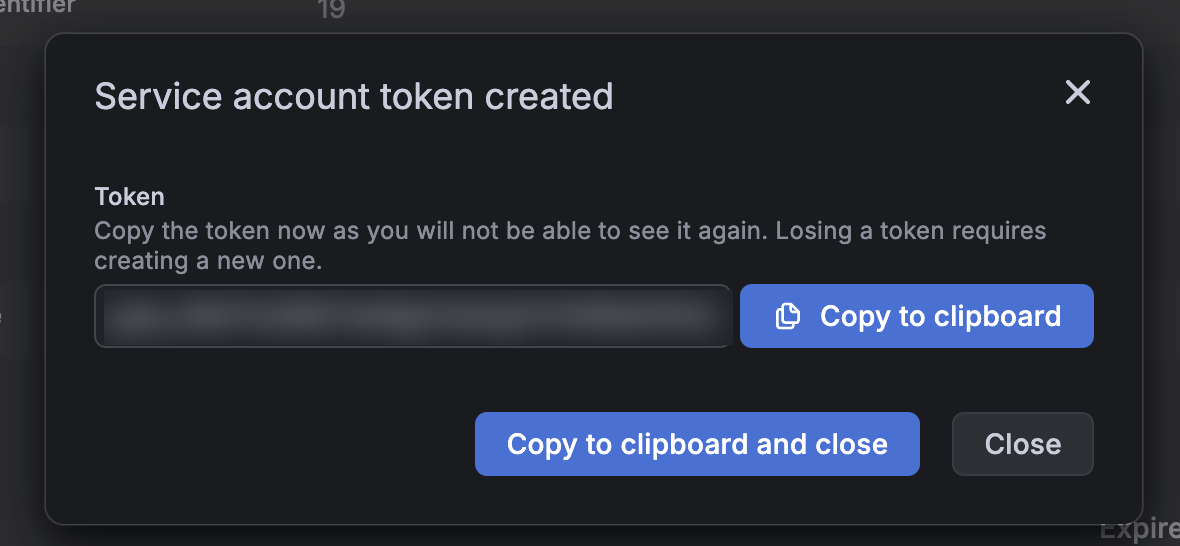
Add Grafana to MintMCP
The self-hosted Grafana connector is pre-listed in the MintMCP MCP store. Installing it opens a configuration screen with two fields.
- In MintMCP, go to MCP store > Manage store
- Find Grafana (self-hosted) in the recommended servers list and click Install
- In the
GRAFANA_URLfield, enter your instance address (e.g.https://grafana.example.com) - In the
GRAFANA_SERVICE_ACCOUNT_TOKENfield, paste the token from the previous step - Click Install
On a multi-organization Grafana instance, also set GRAFANA_ORG_ID to the numeric org ID you want the connector to target. Without it the connector uses the token's default org.
What the connector exposes
| Area | What users can do |
|---|---|
| Search and navigation | Search dashboards and folders, generate deeplinks to dashboards, panels, and Explore queries |
| Dashboards | Retrieve dashboard summaries and panel queries, create folders, update dashboards, export panel images |
| Metrics | Run Prometheus queries, discover metric names, explore label names and values |
| Logs | Run Loki queries, detect log patterns, fetch statistics, analyze labels |
| Traces and profiles | Search and inspect Tempo traces, query Pyroscope profiling data |
| Data sources | List and inspect data source configurations, check data source health |
| Alerting | Inspect and manage alert rules, notification routing, and silences |
| Incident response | Create and track incidents, manage OnCall schedules, shifts, and teams |
| Investigations | Start and inspect Sift investigations, find error patterns and slow requests |
The connector also discovers MCP-capable data sources on your instance and exposes their tools, so the exact tool list depends on what you have configured.
Security considerations
- The service account token is a single shared credential, so every tool call runs as that identity. Grafana's audit log attributes activity to the service account, not to individual people. If you need per-user attribution on Grafana Cloud, use per-user OAuth instead.
- Grant the service account the lowest role that works. Viewer is enough for querying dashboards, metrics, logs, and traces, and it makes the write tools fail closed even if they are exposed.
- Grafana's service account tokens do not expire unless you set an expiration date. Rotate by generating a new token on the same service account and updating the connector, then delete the old one.
- The connector connects outbound to your Grafana instance only, and no observability data is stored in MintMCP beyond what individual tool calls return.
Troubleshooting
- Connection timeout or tool calls hang: Grafana is not reachable from MintMCP. Verify the URL is publicly accessible, or contact enterprise@mintmcp.com to get the dedicated egress IP and add it to your Grafana server's allowlist.
- 401 or "Unauthorized" on every tool: The token is wrong, was revoked, or has expired. Generate a new service account token and update
GRAFANA_SERVICE_ACCOUNT_TOKEN. - Tools return data from the wrong organization: Set
GRAFANA_ORG_IDto the numeric ID of the org you want, or the connector uses the token's default org. - Write tools fail with a permissions error: The service account has the Viewer role. Change it to Editor on the service account page, or use tool customization to hide the write tools from users who don't need them.
- Admin and user tools fail: Those need a service account with the Admin role. Most deployments should leave them unexposed rather than granting Admin.
Next steps
- Tool customization: Control which Grafana tools are exposed to users
- MCP gateway administration: Manage access and permissions