Usage and cost tracking
See what your agents cost. The Usage tab in Agent Monitor turns the token telemetry agents already report into a spend dashboard, so you can answer "how much are we spending on AI, on what, and by whom" without wiring up a separate billing pipeline.
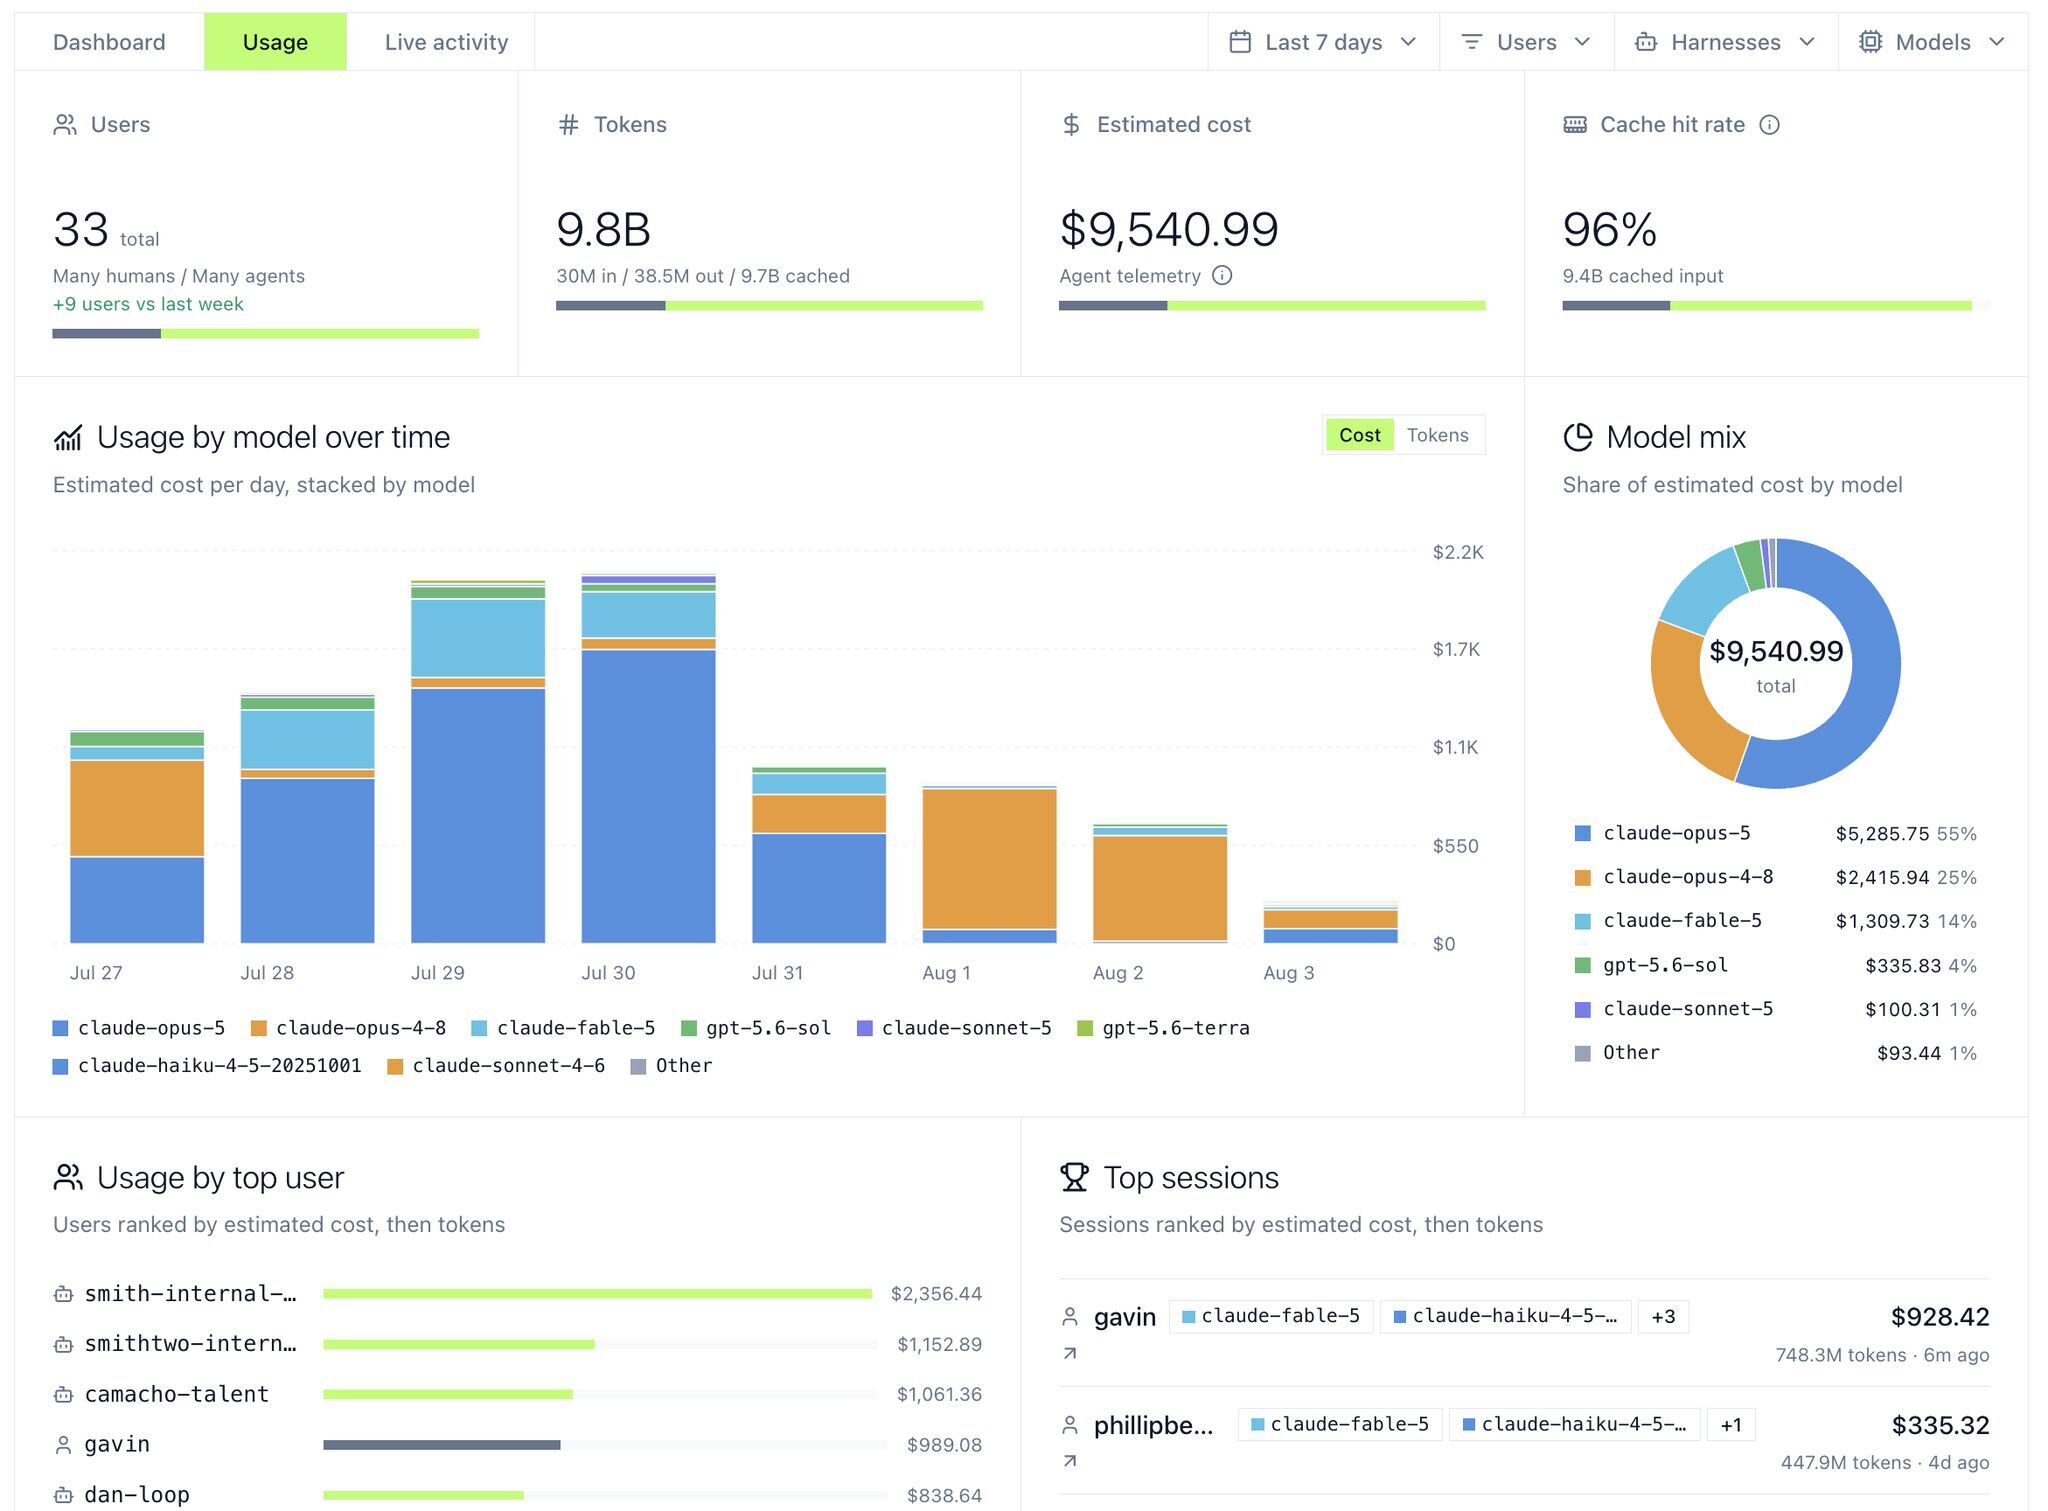
Open it from Agent Monitor → Usage.
What you can see
The summary cards across the top give you the headline numbers for the selected range:
- Users — how many people and agents were active, with the change versus the previous period.
- Tokens — total tokens consumed, split into input, output, and cached.
- Estimated cost — dollar spend across every tracked agent.
- Cache hit rate — the share of input tokens served from the model provider's prompt cache. Cached reads cost a fraction of fresh input, so a high rate means cheaper requests.
Below the cards, four panels break the numbers down:
- Usage by model over time — a daily stacked chart you can toggle between cost and tokens, so you can spot a spike and see which model caused it.
- Model mix — the share of spend by model, which makes it obvious when an expensive model is doing work a cheaper one could handle.
- Usage by top user — people and agents ranked by cost, so the heaviest consumers surface immediately.
- Top sessions — the most expensive individual agent sessions, each linking straight into the live activity view for that session.
Every measure is also split between human and agent usage, so you can tell interactive work apart from autonomous agents running on their own.
Filter and drill down
Narrow any view with the filters in the top bar:
- Time range — last 7 days, 30 days, or a custom window.
- Users — focus on a person or agent.
- Harnesses — filter by client, such as Claude Cowork, Claude Code, Cursor, Codex, or GitHub Copilot.
- Models — isolate a single model's cost and volume.
Clicking a model in a chart or a user in a ranking applies that filter, and expensive sessions link into live activity so you can see exactly what an agent was doing when it ran up the cost.
How costs are estimated
Costs are estimated from the token counts agents self-report through usage telemetry, priced at each model's published rates. This is an estimate for visibility and chargeback, not a billing statement, and only agents with telemetry enabled are counted. Tools that report no cost telemetry still appear by token volume.
Turn on usage telemetry
Usage data comes from the telemetry your monitored agents send. To start seeing numbers:
- Monitored clients (Claude Cowork, Claude Code, Cursor, Codex, GitHub Copilot) — enable usage telemetry when you set up monitoring. The Usage tab links to the setup page with the telemetry option pre-selected if no data has arrived yet.
- Coworker agents report usage automatically; you can turn it off per agent from that agent's settings.
Once telemetry is flowing, the Usage tab populates on its own—no extra configuration.