Monitoring and analysis
Review the inference that flows through the LLM gateway. Every gateway call is logged to the Agent Monitor as part of a unified lifecycle with your other agent events, so inference sits alongside tool calls rather than in a separate silo.
Individual request logs
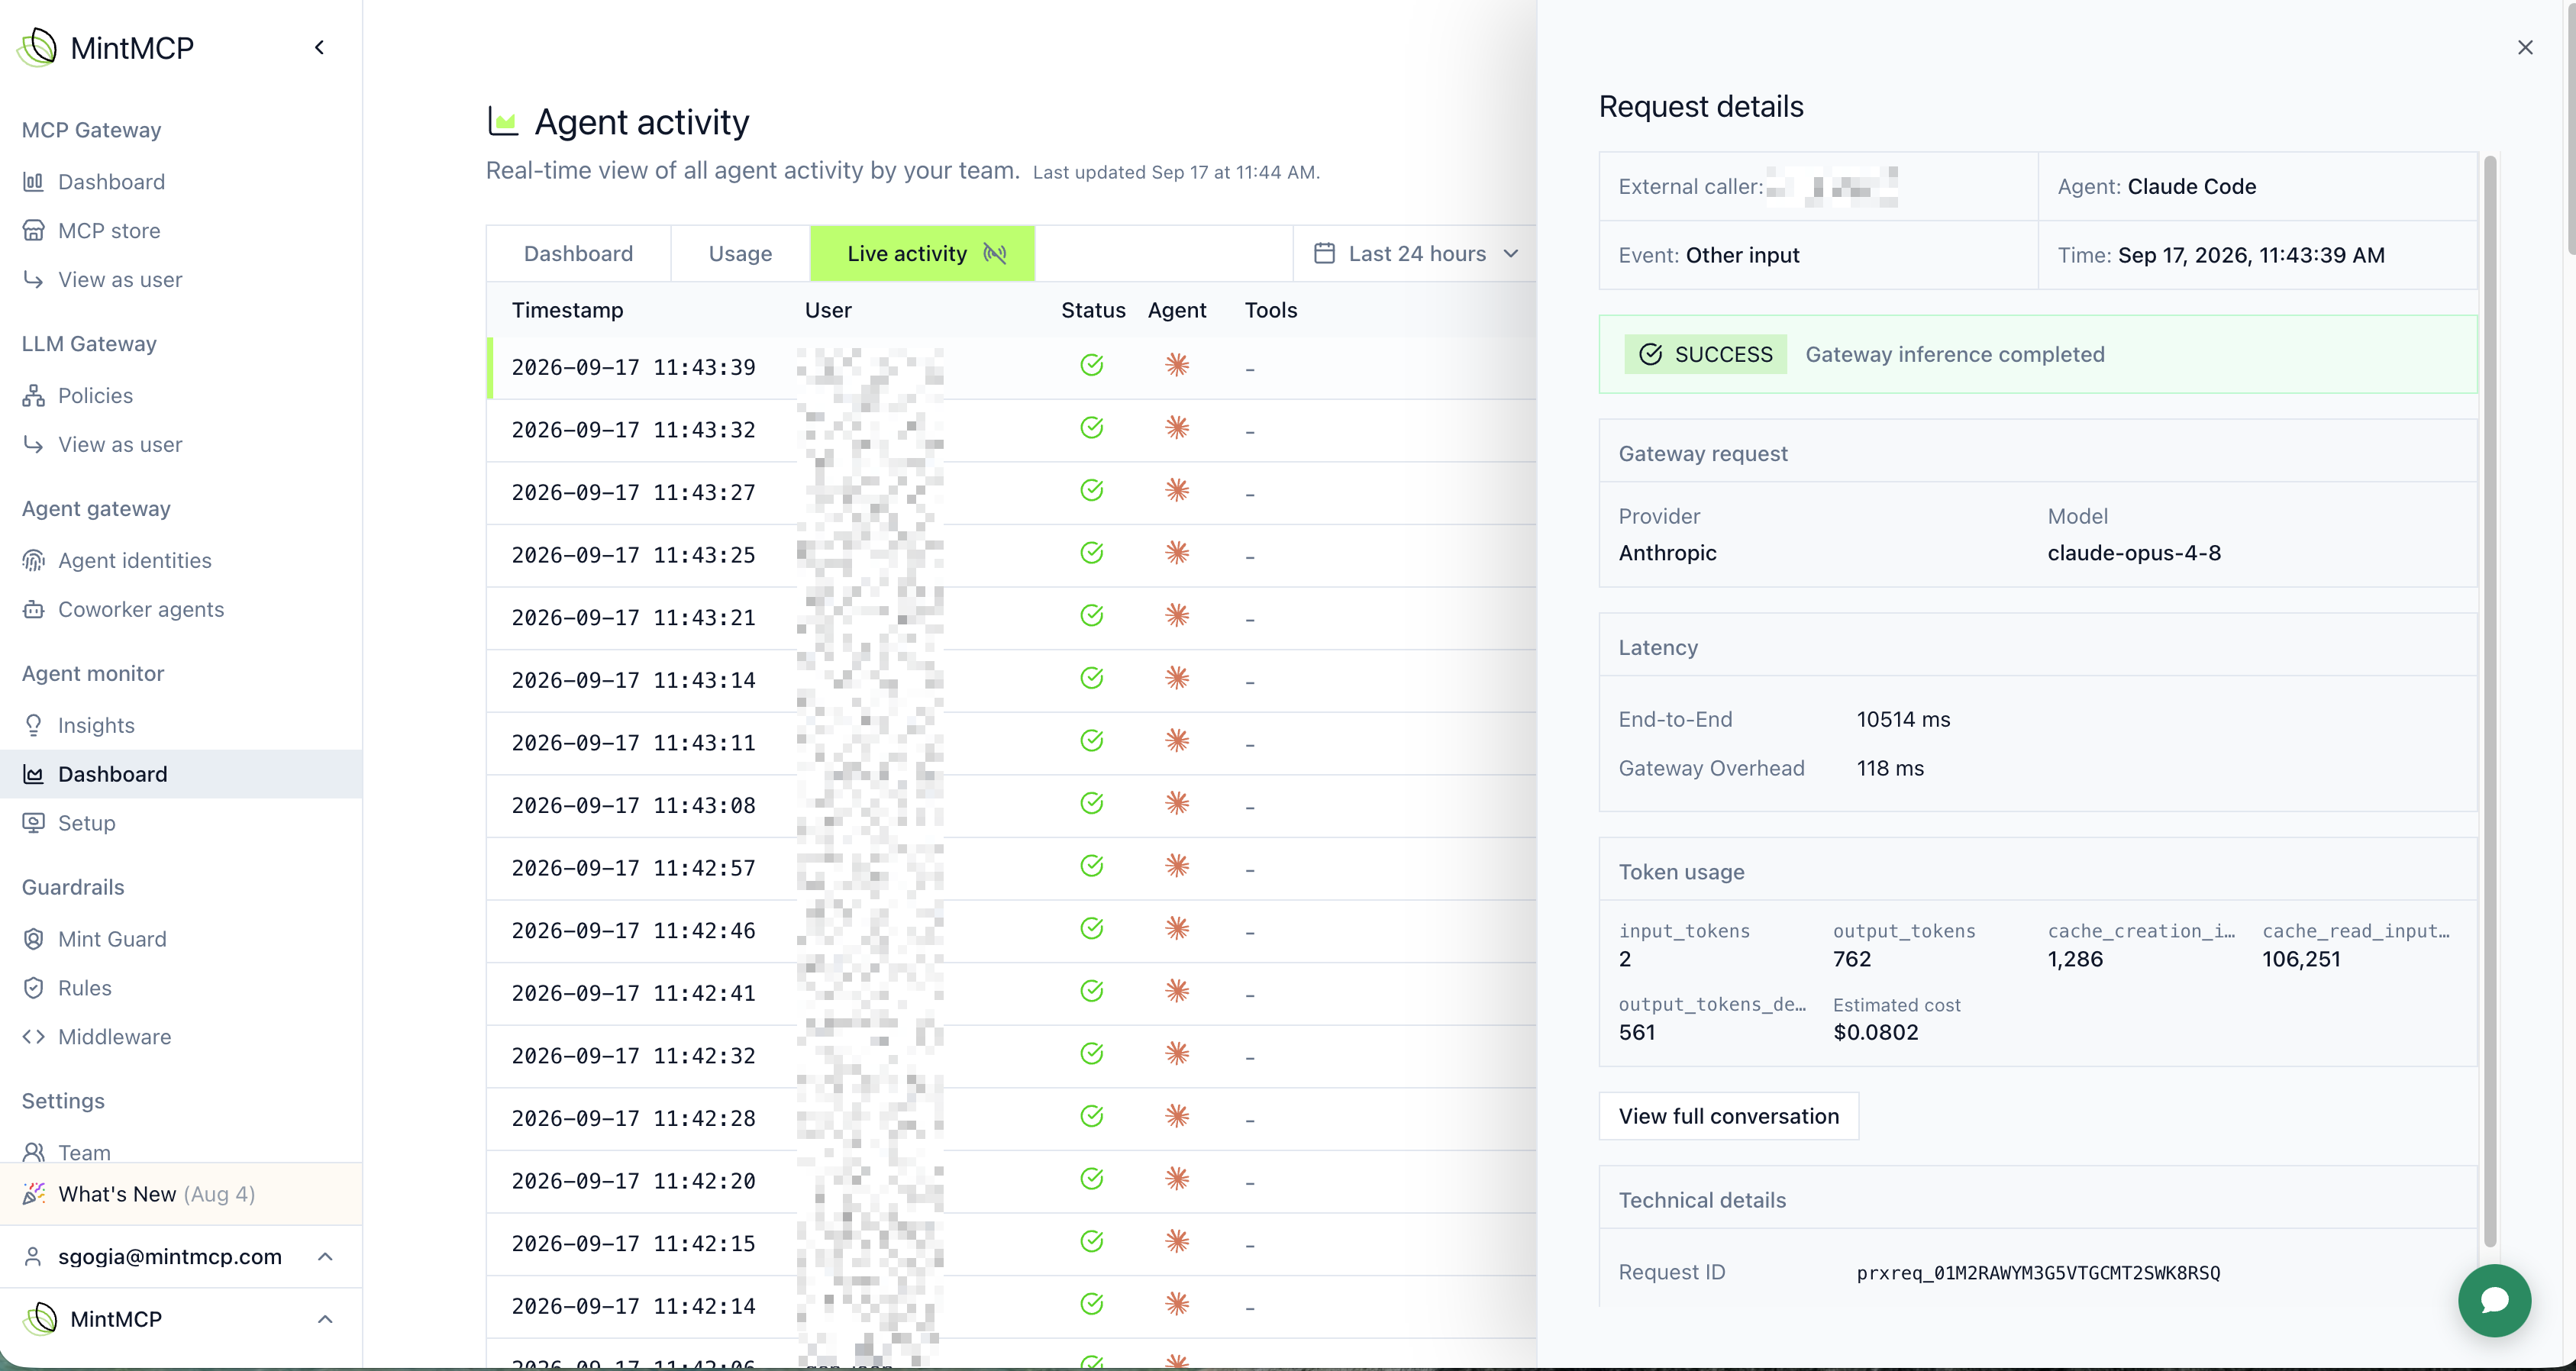
LLM gateway calls appear in the Agent Monitor's Live activity view. For each call you can see:
- Latency, including the gateway's own overhead
- Usage and cost for the call
- Provider and model selected
- Prompt and tool-result data, when logging is enabled
Usage dashboard
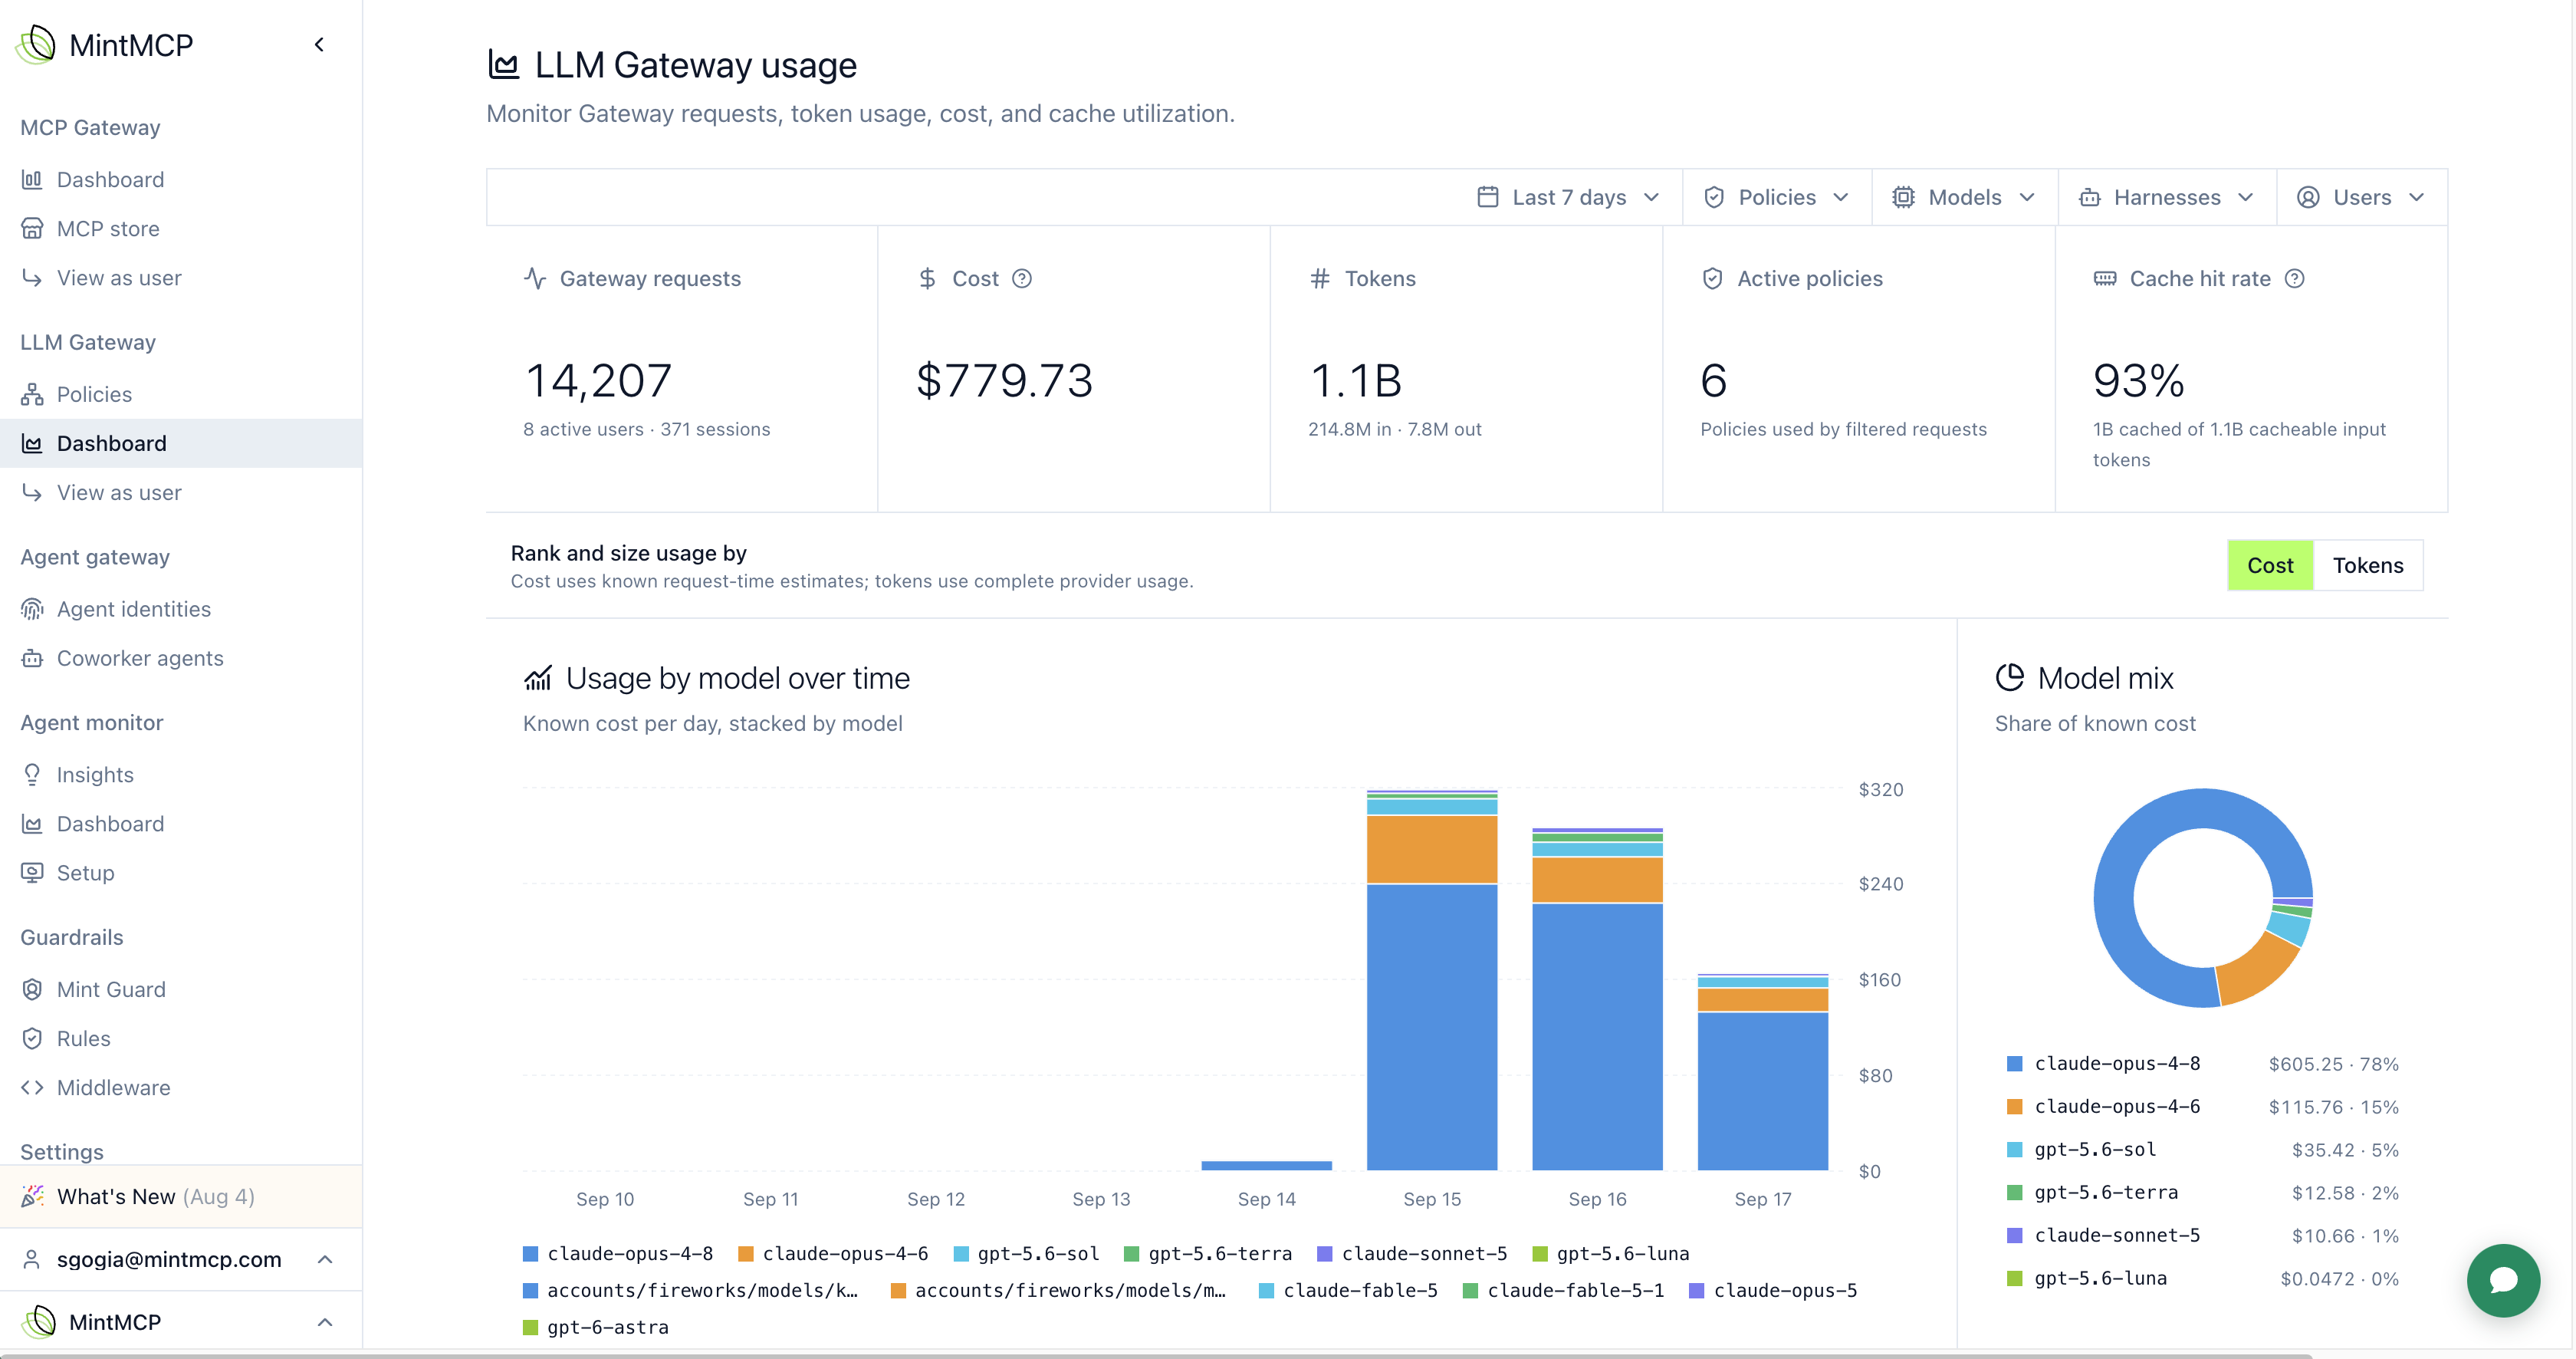
The same Agent activity page has a Usage tab that gives high-level data on usage across your policies, for a quick read on volume and spend without opening individual calls. See Agent Monitor usage for the broader usage reference.
Next steps
- Budgets: turn usage insight into spend caps
- Provider and model selection: restrict models based on what you see