MCP tool failures can be difficult to diagnose when the client or agent does not clearly surface the underlying error. A broken connection, invalid configuration, or failed tool call may appear to users as an assistant that cannot access Salesforce, query a database, or complete an expected action. MCP Inspector solves this problem by letting operations teams test and validate Model Context Protocol servers before connecting them to production AI tools like Claude, Cursor, ChatGPT, Gemini, and Copilot. Think of it as Postman for AI agents. For organizations running multiple MCP servers at scale, pairing Inspector with a centralized MCP Gateway creates a testing and governance workflow from development through production. MintMCP's Agent Gateway builds on that foundation with identities, permissions, memory, and monitoring for agents that operate through those governed connections.
Key Takeaways
- MCP Inspector is the official debugging tool for testing MCP servers before production deployment, available free and open source
- Pre-production testing with Inspector helps teams catch configuration and protocol issues before agents encounter them
- CVE-2025-49596, a critical RCE vulnerability with CVSS 9.4, affected Inspector versions before 0.14.1 and requires immediate upgrade
- Relative paths are a common source of connection failures for locally launched STDIO servers because the client's working directory may differ from the developer's shell environment
- Inspector's CLI mode enables automated regression testing in CI/CD pipelines, catching breaking changes before they reach production
- Pre-deployment testing can reduce the amount of production troubleshooting required when MCP server configurations or tool schemas change
Understanding the MCP Ecosystem: A Debugger's Overview
The Model Context Protocol standardizes how AI agents communicate with external tools and data sources. When an agent needs to query a database, access a CRM, or read from a file system, it sends JSON-RPC 2.0 requests over UTF-8 encoded messages to an MCP server that handles the actual operation. This architecture enables AI tools from different vendors to connect to the same tooling infrastructure.
What is an MCP server and why is debugging crucial?
An MCP server exposes tools, resources, and prompts that AI agents can use. When you configure Claude Desktop or Cursor to connect to a GitHub MCP server, for example, that server translates the agent's requests into GitHub API calls and returns the results in a format the agent can process. The server acts as the bridge between what the agent wants to do and how the underlying system actually works.
Debugging matters because MCP servers fail in ways that are invisible to end users. Unlike traditional APIs that return clear error codes, a misconfigured MCP server often just disappears from the agent's available tools. The agent continues operating without access to the tool, and users assume the AI "doesn't know how to do that" rather than recognizing a configuration problem.
Common challenges in MCP server deployment
Teams deploying MCP servers encounter several recurring issues:
- Path resolution failures: Servers configured with relative paths work in development but fail when the AI client runs from a different working directory
- Authentication mismatches: OAuth flows that succeed in testing break when deployed to production environments with different redirect URIs
- Tool catalog changes: Upstream MCP servers can add, remove, or modify tools over time. MCP supports tool-list change notifications, but workflows can still break when clients do not handle those changes or depend on a specific tool schema
- Environment differences: A server that runs correctly on a developer's machine crashes when deployed because of missing environment variables or different runtime versions
Leveraging Developer Tools for MCP Server Inspection
For MCP servers using Streamable HTTP, standard browser developer tools provide a first line of debugging capability. The Network tab shows the actual JSON-RPC messages flowing between client and server, revealing whether requests are malformed or responses are missing expected fields.
Using browser dev tools for Streamable HTTP MCP servers
When testing an MCP server through a browser-based client or web debugging interface, open the browser's developer tools and monitor the Network tab while requests are made. For desktop clients such as Cursor or Claude Desktop, use the client's logs or MCP Inspector to inspect protocol traffic. Look for:
- HTTP status codes: 401 indicates authentication problems; 403 suggests permission issues; 500 signals server-side errors
- Response payloads: Valid MCP responses contain a
resultfield; errors contain anerrorobject withcodeandmessageproperties - Request headers: Missing or incorrect Authorization headers cause silent authentication failures
The Console tab captures JavaScript errors from streaming connections, including connection timeouts and parsing failures that might not surface elsewhere.
Inspecting network traffic for MCP requests and responses
MCP uses JSON-RPC 2.0 as its message encoding format. A valid modern MCP request includes:
- A
jsonrpcfield set to "2.0" - A unique
idfor correlating responses - A
methodfield specifying the operation - A
paramsobject containing the method's inputs - Required
_metafields declaring the MCP protocol version and client capabilities
When debugging, compare your actual requests against this structure. Missing fields or incorrect types cause servers to reject requests without clear error messages.
API Testing and Debugging with Postman for MCP Services
Postman allows direct testing of MCP server endpoints outside the context of any AI client. This isolation helps determine whether problems originate in the server itself or in the client's configuration.
Configuring Postman for JSON-RPC 2.0 requests
To test an MCP server with Postman:
- Create an MCP request and enter your server's Streamable HTTP endpoint
- Configure authentication if the server requires it
- Connect to the server and load its available MCP methods and tools
- Use
tools/listto confirm tool discovery before testing individual tool calls
Postman's native MCP request support handles the protocol-specific request structure required by current MCP servers.
Debugging MCP server endpoints with Postman
Once basic connectivity works, test individual tools by changing the method to tools/call and specifying the tool name and arguments in params. Compare the responses against expected outputs documented for each tool.
Common issues revealed through Postman testing include:
- Incorrect parameter names: Tool arguments are case-sensitive and must match exactly
- Type mismatches: Sending a string when the tool expects a number causes silent failures
- Missing required parameters: Some tools fail without proper error messages when required arguments are omitted
MintMCP's REST APIs and SDKs enable similar programmatic testing against governed MCP endpoints, with the added benefit of full audit logging for compliance requirements.
Advanced Debugging Tools and Techniques for MCP Servers
MCP Inspector, the reference developer tool maintained by the Model Context Protocol project, provides web, CLI, and terminal interfaces specifically designed for MCP server testing. It handles STDIO for local subprocesses and Streamable HTTP for remote servers, while retaining compatibility with legacy MCP transport versions where supported.
Running MCP Inspector
Launch Inspector with a single command:
npx @modelcontextprotocol/inspector
This opens a browser interface at http://localhost:6274. From there, select your transport type, enter your server command or URL, and connect. Basic testing requires launching Inspector and supplying the command or URL for the MCP server you want to inspect.
Debugging locally-run STDIO MCP servers
STDIO servers run as local subprocesses, communicating through standard input and output streams. This transport type is common for servers that need access to local files or development tools.
When debugging STDIO servers:
- Use absolute paths: Relative paths that resolve differently when launched from the Inspector versus your AI client are a common failure cause. Always specify
/full/path/to/server.pyrather than./server.py - Check environment variables: STDIO servers inherit environment variables from their parent process. Inspector may not have the same environment as your shell
- Monitor startup time: Servers that take too long to initialize can timeout
Interpreting server-side logs and error messages
MCP Inspector displays raw JSON-RPC messages in a dedicated panel, showing exactly what the server sends and receives. When tools fail to appear after connection:
- Check the terminal where you launched Inspector for Python/Node errors
- Look for partial JSON responses indicating the server crashed mid-response
- Verify protocol compatibility and confirm that the server accepts the client's protocol version and request metadata
Real-time Monitoring and Observability for MCP Server Health
Inspector handles development and pre-production testing, but production MCP servers require continuous monitoring. When an agent's tool stops working at 3 AM, you need visibility into what changed.
Setting up dashboards for MCP server performance
Production MCP monitoring should track:
- Tool call latency: Sudden increases indicate server performance degradation
- Error rates by tool: Spikes in specific tool failures point to integration problems
- Usage patterns by team: Helps identify which tools are critical and which are unused
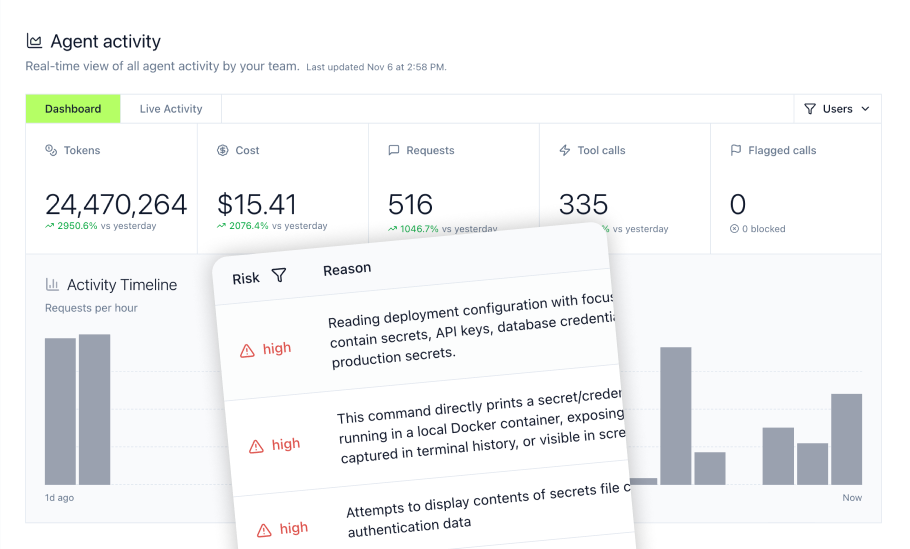
MintMCP combines gateway-level visibility into MCP usage, performance, and errors with Agent Monitor, which extends monitoring into local agent activity such as MCP usage, Bash commands, and file access in supported developer environments.
Proactive alerting for MCP server anomalies
Configure alerts for:
- Connection failures exceeding baseline rates
- New error types not seen previously
- Latency exceeding defined thresholds
- Tool availability changes (tools appearing or disappearing from servers)
Export logs to your existing SIEM or log-storage workflows for correlation with other infrastructure events. This integration helps identify whether MCP failures relate to broader system issues.
Debugging AI Agent Tooling and Interaction within MCP
The intersection of AI agents and MCP servers creates unique debugging challenges. Problems can originate in the agent's prompting, the gateway's policy enforcement, or the server itself.
Troubleshooting agent-to-tool communication failures
When an agent fails to use a tool, work backward through the chain:
- Verify the tool appears in the agent's context: Use Inspector to confirm the tool is listed and its schema matches documentation
- Check for policy blocks: Gateway-level policies may prevent specific tools based on user role or data classification
- Review the agent's prompt: Some agents need explicit instruction to use specific tools rather than attempting alternative approaches
Debugging policy enforcement and access control for agents
Centralized MCP gateways apply access policies at the tool level. A tool that works for one user may be blocked for another based on their group membership. When debugging access issues:
- Confirm the user's group assignments in your identity provider
- Review tool-level access rules in your gateway configuration
- Check audit logs for policy-blocked requests
MintMCP's Bundle model ties SCIM group membership to curated MCP server lists, making it straightforward to trace why specific users can or cannot access particular tools.
Identifying and resolving shadow AI usage issues
Agents running outside governed infrastructure create blind spots. Developers installing MCP servers directly in Cursor or Claude Code bypass organizational policies and create unaudited tool access.
Agent Monitor detects off-gateway MCP usage through hooks in Cursor and Claude Code, identifying when developers use MCP servers that are not routed through the organization's gateway. This shadow AI detection ensures that pre-production testing with Inspector translates to governed production usage.
Securing Your Debugging Workflow: Best Practices for MCP
Debugging MCP servers often involves handling credentials, accessing production data, and exposing internal systems. Treating debugging as a security-sensitive activity prevents accidental data exposure.
Critical security context: CVE-2025-49596
MCP Inspector versions before 0.14.1 contained a critical Remote Code Execution vulnerability rated CVSS 9.4. Malicious websites could execute arbitrary commands on developer machines running vulnerable Inspector versions. The vulnerability was patched in v0.14.1 (June 2025) through mandatory session tokens and Origin header validation.
Action required: Do not run Inspector versions below 0.14.1. For current deployments, use the latest Inspector v2 release with Node.js 22.19.0 or newer:
npx @modelcontextprotocol/inspector@latest
Never expose Inspector to public networks, even with the patch applied.
Protecting sensitive data during MCP server troubleshooting
When debugging production-connected servers:
- Use test credentials with limited permissions rather than production service accounts
- Sanitize logs before sharing with team members or vendors
- Avoid testing with real customer data when possible
MintMCP's gateway middleware supports inline DLP integration with Bedrock Guardrails, GCP DLP, Microsoft Purview, Nightfall, and Skyflow, providing data protection even during debugging sessions.
Ensuring auditability of all debugging actions
Maintain audit trails of debugging activity for compliance and incident response:
- Log which users ran Inspector against which servers
- Record parameter values used in test tool calls
- Document any configuration changes made during troubleshooting
For organizations with compliance requirements, MintMCP provides conversation-level logging capturing prompts, tool calls, responses, and context with configurable retention and SIEM export.
Troubleshooting Common MCP Server Issues and Error Codes
Here are the issues teams encounter most frequently:
Server won't connect
Symptoms: Inspector shows "Connecting..." indefinitely or returns a connection timeout error.
Solutions:
- Verify the server command runs successfully outside Inspector
- Use absolute paths for all file references
- Check whether the MCP server's configured port is already in use. If Inspector itself cannot start, separately check whether its local web interface port is occupied
- For Streamable HTTP servers, confirm the URL is reachable from your machine
Tools don't appear after connection
Symptoms: Inspector connects successfully but the Tools tab shows zero items.
Solutions:
- Check the terminal for server crash messages during startup
- Verify protocol compatibility and inspect the request metadata if the server rejects the connection
- Inspect Inspector's protocol traffic and server logs, or use the CLI's
--log-leveloption when testing MCP logging behavior - Test the server command manually to confirm it produces tool listings
Authentication errors (401/403)
Symptoms: Server returns 401 Unauthorized or 403 Forbidden responses.
Solutions:
- Reconnect to the OAuth-protected server and complete the authorization flow when Inspector prompts for authentication
- Manually obtain an API token and add it to the Authorization header
- Verify token scopes match the permissions required by the tools you are testing
Rate limiting
Symptoms: Tools work initially but start failing under load with 429 responses.
Solutions:
- Reduce testing frequency
- Check if the upstream service has different rate limits for test versus production credentials
- Configure retry logic with exponential backoff
MintMCP Solutions: Streamlining Your MCP Debugging Process
While MCP Inspector excels at development-time testing, production MCP deployments require additional capabilities that span the full lifecycle from pre-deployment validation through ongoing monitoring.
How MCP Gateway simplifies server diagnostics
MCP Gateway centralizes MCP server management with features that complement Inspector-based testing:
- OAuth brokering: Automatically handles OAuth flows for servers that require user authentication, eliminating manual token management during testing
- STDIO to hosted conversion: Converts locally-run STDIO servers to hosted, production-ready services with OAuth wrapping and no code changes required
- Full audit logging: Captures every tool call with user attribution, enabling post-incident analysis when issues reach production
Agent Monitor's role in proactive problem identification
Agent Monitor extends observability beyond the gateway:
- Real-time activity tracking: See agent actions as they happen, not hours later in logs
- Shadow AI detection: Identify developers using MCP servers outside governed infrastructure
- Custom guardrail policies: Block, flag, or alert on specific behaviors including PII exposure and prompt injection attempts
- Risky behavior detection: Automatic detection of credential leakage (API keys, tokens) and dangerous bash commands
The Bundle model for isolating and debugging agent behavior
MintMCP's Bundle architecture simplifies debugging by creating clear boundaries between different use cases:
- Each Bundle provides a single endpoint with a curated tool list and defined access policy
- When tools fail for specific users, check their Bundle membership rather than tracing through complex permission matrices
- Agent Bundles give each AI agent its own persistent identity with scoped credentials, making it straightforward to isolate which agent caused a specific issue
From Testing to Production: A Complete MCP Lifecycle
Organizations deploying MCP at scale can follow a simple pattern: test with Inspector during development, govern with MCP Gateway in production, and monitor agents with Agent Gateway.
MCP Gateway handles connection management, authentication, tool routing, and access policies. Agent Gateway extends that foundation with persistent agent identities, scoped and reviewable memory, and behavioral monitoring.
For coworker agents that operate in Slack, retain memory, and continue work across days, this added governance helps teams trace agent activity and review how tools and data are being used.
Together, Inspector, MCP Gateway, and Agent Gateway provide a practical path from development testing to governed production deployment.
Frequently Asked Questions
Can MCP Inspector test servers that require complex OAuth flows?
MCP Inspector supports the current MCP authorization flow across its Web, CLI, and TUI clients, including authorization-server discovery, dynamic or pre-registered clients, scopes, persisted credentials, and mid-session re-authorization. Provider-specific or nonstandard enterprise authentication requirements may still require additional configuration. MintMCP's Gateway provides OAuth brokering that handles complex flows automatically, which can simplify testing for servers with enterprise authentication requirements.
How do I debug MCP servers running in Docker containers?
For a container exposing a remote MCP endpoint, use Inspector's Streamable HTTP transport. If the containerized server communicates over STDIO, Inspector can instead launch the container as the STDIO subprocess. Use docker logs to capture server-side error messages, and verify the container has all required environment variables and dependencies. The official MCP Inspector documentation provides additional guidance on testing container-based MCP servers.
What is the difference between MCP Inspector and unit testing for MCP servers?
Unit tests verify that individual functions within your server code work correctly in isolation. MCP Inspector performs integration testing at the protocol level, verifying protocol compatibility, request metadata, tool listing, and tool execution. Inspector can also test the initialization lifecycle when working with legacy MCP protocol versions. Both are necessary: unit tests catch implementation bugs, while Inspector catches protocol compliance issues and configuration problems that only manifest when the server communicates with actual MCP clients.
How do I automate MCP server testing in a CI/CD pipeline?
MCP Inspector includes a CLI mode for automated testing. Add commands like npx @modelcontextprotocol/inspector --cli node server.js --method tools/list to your pipeline scripts. The CLI returns non-zero exit codes on failures, enabling automatic build failures when server behavior changes unexpectedly. Snapshot tool schemas between runs to detect breaking changes in tool signatures.
Why do my MCP server tests pass locally but fail in production AI clients?
Environment differences cause most local-vs-production discrepancies. Common causes include working directory differences (relative paths resolve differently), missing environment variables, different Node.js or Python versions, and network configuration changes. When testing locally, replicate the exact command and environment your production AI client uses. Export working configurations from Inspector and compare them against your client's configuration file to identify discrepancies.