Your AI agent just failed for the tenth time today. The LLM returned a response—somewhere in the eight-turn conversation, it lost context and gave the user garbage. You open your logs and see nothing that explains why. This gap between knowing that something failed and understanding why it failed represents the core distinction between monitoring and observability—a distinction many teams fail to address before reaching production. Enterprise teams deploying AI agents through tools like MintMCP's LLM Proxy need both capabilities working together, yet most organizations conflate them and suffer the consequences.
This article clarifies the critical differences between AI agent monitoring and observability, explains why traditional application monitoring tools fail for agentic systems, and provides actionable guidance for implementing comprehensive visibility into your AI infrastructure.
Key Takeaways
- Monitoring tells you what failed; observability tells you why—teams treating agents like REST APIs often miss failure modes including silent tool errors and cascading hallucinations
- Model behavior can degrade over time without continuous monitoring, making observability essential for production reliability
- Traditional APM tools cannot model multi-step agent causal chains—teams often discover that Datadog-style monitoring is insufficient for agentic workflows
- 42% of companies abandon most of their AI initiatives before production, making observability a business-critical investment
- Organizations implementing observability during development rather than post-failure can iterate faster and reduce the risk of production failures
- Setup time varies widely by platform complexity—lightweight gateway proxies enable faster starts while comprehensive platforms require more configuration
- Cost savings opportunities on API spend become visible through proper cost attribution and usage tracking across teams and projects
Understanding the Core Differences: Monitoring vs. Observability for AI Agents
Traditional monitoring answers a simple question: Is the system running? It tracks uptime, latency, error codes, and resource utilization. When your agent returns a 200 status code, monitoring marks it as successful. Observability asks the harder question: How is the system reasoning?
The distinction matters because AI agents are non-deterministic, multi-turn systems where the same input can produce different outputs. A failure at step three of an eight-step workflow may only manifest as garbage output at step eight. Monitoring sees a successful completion; observability traces the entire decision chain and identifies exactly where context was lost.
What monitoring captures:
- Uptime and availability metrics
- Response latency and error rates
- Resource consumption (CPU, memory, tokens)
- Basic alerting when thresholds are exceeded
What observability captures:
- Sessions (multi-turn conversations), traces (single requests), and spans (logical work units)
- Tool invocations and their inputs/outputs
- Retrieval operations from knowledge bases
- The causal chain connecting user intent to final output
As enterprises recognize that monitoring alone cannot support production AI deployments, investment in AI observability and agent operations tooling is growing rapidly. Understanding MCP gateways becomes essential for teams building this visibility into their infrastructure.
Why Traditional Application Monitoring Falls Short for AI Agents
Application Performance Monitoring (APM) tools like Datadog, New Relic, and Dynatrace were built for deterministic systems. They excel at tracking request-response patterns where the same input consistently produces the same output. AI agents break this model in several fundamental ways.
The black box problem: Traditional APM treats each API call as an independent event. When an agent makes eight sequential LLM calls, tool invocations, and retrieval operations to complete a task, APM shows eight separate events with no connection between them. You cannot reconstruct why the agent chose to call a specific tool or how earlier context influenced later decisions.
Dynamic, non-deterministic behavior: Agents adapt their execution path based on intermediate results. The same user query might trigger three tool calls on Monday and seven on Tuesday, depending on retrieved context and model reasoning. APM dashboards designed for consistent request patterns cannot represent this variability meaningfully.
Multi-agent coordination failures: Modern systems increasingly use specialized agents that hand off work to each other. A financial workflow might route through ingestion, feature extraction, strategy, and risk agents. When the strategy agent produces incorrect output, the root cause may trace back to corrupted features from step two. Traditional APM cannot model these cascading dependencies.
Silent failures with correct status codes: An agent can return a well-formed response that is factually wrong, hallucinates policy details, or misunderstands user intent—all while logging "200 OK." Without quality evaluation layers that assess semantic correctness, these failures remain invisible to traditional monitoring.
The Imperative of AI Observability Tools in Enterprise Environments
AI observability platforms transform opaque agent systems into transparent, debuggable workflows. They capture every decision an agent makes—from understanding user intent through tool invocations to final outputs—and connect them into traceable chains.
When an agent hallucinates a policy detail or fails silently at step three of eight, observability shows exactly where and why. This capability enables teams to fix root causes rather than symptoms.
Core observability capabilities:
- Distributed tracing: Captures the complete execution path including LLM calls, tool invocations, retrieval operations, and multi-turn session context
- Quality evaluation: Automated assessment of hallucination rate, intent recognition accuracy, and task completion using LLM-as-judge or custom evaluators
- Cost attribution: Real-time token usage and spending tracked by user, session, model, and use case with budget alerting
- Multi-agent workflow support: Traces interactions between specialized agents, tracking handoffs, shared state, and coordination failures
The MCP Gateway provides this observability through real-time dashboards for monitoring usage, detecting anomalies, and maintaining SLA compliance across all MCP connections. Combined with complete audit trails for every interaction, teams gain the visibility required for both debugging and compliance.
Enterprise case studies demonstrate concrete results. Swiss Life achieved 96% intent recognition accuracy through comprehensive observability. BarmeniaGothaer reduced switchboard workload by 90% with continuous monitoring of agent performance. Sixty percent of customers reported that their experience with AI agents improved their perception of the company.
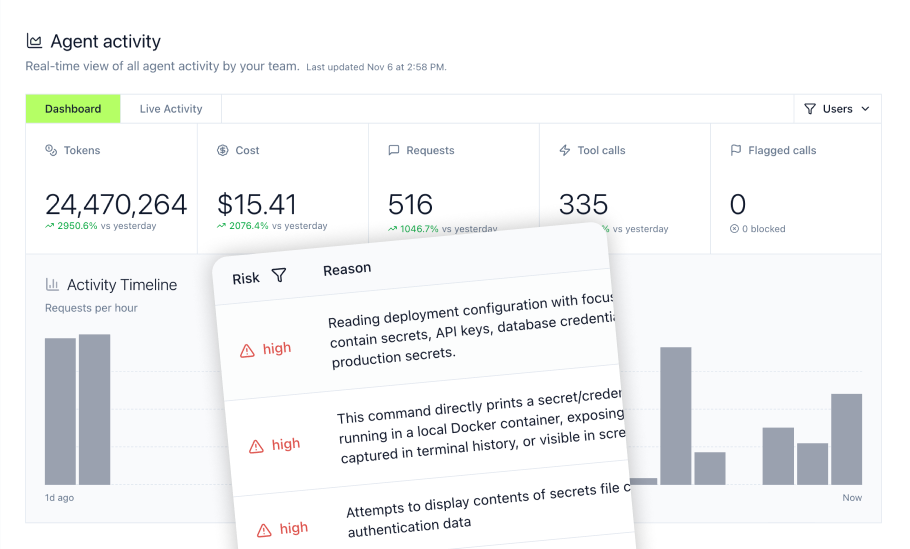
Monitoring AI Agents: Tracking Tool Calls, Usage, and Security Risks
Even with observability infrastructure in place, specific monitoring capabilities remain essential for operational control. AI agents operate with extensive system access—reading files, executing commands, and accessing production systems through MCP tools. Without proper monitoring, organizations cannot see what agents access or control their actions.
Critical monitoring signals for AI agents:
- Tool call tracking: Every MCP tool invocation, bash command, and file operation should be logged with inputs, outputs, and timing
- MCP inventory: Complete visibility into installed MCPs, their permissions, and usage patterns across teams
- Data access logs: Records of exactly what data each AI tool accesses and when
- Security alerts: Real-time notifications when agents attempt dangerous operations or access sensitive resources
Spotting 'Shadow AI' Through Agent Monitoring
Shadow AI—unauthorized AI tool usage—represents a significant security and compliance risk. Employees installing their own MCP tools or using unsanctioned AI assistants create blind spots in your security posture.
Effective monitoring reveals which AI tools teams are actually using versus what is officially sanctioned. MintMCP's LLM Proxy provides visibility into installed MCPs and monitors their usage across coding agents like Cursor, Claude Code, and VS Code extensions, enabling organizations to turn shadow AI into sanctioned AI.
Implementing Security Guardrails for AI Tools
Monitoring without enforcement provides awareness but not protection. Security guardrails must operate in real-time to block dangerous operations before they execute.
Essential guardrails include:
- Blocking commands that read environment secrets or SSH keys
- Preventing access to .env files and credential stores
- Restricting file system access to approved directories
- Controlling which MCP tools each role can invoke
- Rate limiting to prevent resource exhaustion
The LLM Proxy implements these guardrails through configurable rules that block risky tool calls in real-time while maintaining complete audit trails for security review. This approach aligns with EU AI Act requirements for continuous monitoring of high-risk AI systems.
Why Traditional Infrastructure Management Differs for AI Systems
Enterprise infrastructure management tools like Oracle Enterprise Manager were designed for database monitoring, application server oversight, and resource utilization tracking. While valuable for traditional IT operations, they lack the capabilities required for AI agent oversight.
Key differences:
- Agent-based vs. decision-based monitoring: Traditional tools monitor the infrastructure running the agent (CPU, memory, network) but cannot see into the agent's reasoning process
- Deterministic vs. probabilistic systems: Infrastructure monitoring assumes consistent behavior—AI agents produce variable outputs requiring semantic evaluation
- Request-response vs. multi-turn sessions: Legacy tools track individual transactions; agents maintain context across extended conversations
- Static vs. dynamic tool usage: Traditional applications call fixed sets of APIs; agents dynamically select and invoke tools based on context
Organizations with existing investment in infrastructure monitoring should maintain those systems for their intended purpose while deploying specialized AI observability for agent workloads.
Achieving Granular Control and Governance with AI Observability Platforms
Enterprise AI deployment requires more than visibility—it demands governance controls that enforce policies automatically. Observability platforms designed for production use provide centralized governance capabilities.
Essential governance features:
- Role-based access control (RBAC): Define which teams can use which AI tools and access what data
- Granular tool access: Configure tool access by role—enable read-only operations while excluding write tools for specific user groups
- Policy enforcement: Automatically enforce data access and usage policies without manual review
- Compliance reporting: Generate audit trails formatted for SOC 2, GDPR, and regulatory requirements
MintMCP Gateway holds SOC 2 Type II attestation, providing enterprise-grade security controls. The platform uses OAuth-based authentication with SSO support for SAML and OIDC integration with existing identity providers.
Defining Granular Tool Access for AI Agents
Not all users should have equal access to AI capabilities. A customer support agent may need read access to CRM data but should not execute database modifications. A developer might require full tool access in staging but restricted access in production.
Effective platforms support:
- Per-user and per-role tool permissions
- Environment-specific access controls (development vs. production)
- Approval workflows for sensitive operations
- Time-limited access grants for specific projects
Enforcing Data Access and Usage Policies Automatically
Manual policy enforcement does not scale. With agents making hundreds of tool calls daily across multiple users, automated enforcement becomes essential.
The MCP Gateway provides unified authentication, audit logging, and rate control for all MCP connections. This automation maintains compliance without creating bottlenecks in developer workflows.
Real-Time Usage Tracking and Cost Analytics for Enterprise AI Agents
AI infrastructure costs can spiral without visibility. Token usage, API calls, and compute resources accumulate across teams and projects. Effective observability includes cost attribution that enables accountability and optimization.
Cost visibility requirements:
- Per-team and per-project tracking: Understand which groups drive the most usage
- Model-level breakdown: Compare costs across Claude, GPT-4, and other models
- Use case attribution: Identify which workflows consume the most resources
- Budget alerting: Receive notifications before spend exceeds thresholds
Organizations implementing proper cost tracking commonly identify significant savings opportunities through caching optimization and usage pattern analysis.
Monitoring Every AI Tool Interaction Across Diverse Clients
Enterprise environments use multiple AI interfaces—Claude Desktop, Cursor, ChatGPT, Microsoft Copilot, and custom MCP-compatible agents. Observability must span all these touchpoints to provide complete visibility.
MintMCP supports monitoring across multiple major AI clients including Claude (Desktop and Web), ChatGPT via Custom GPTs, Cursor, Gemini, and other platforms, providing unified visibility across the tools employees use.
Breaking Down AI Costs Per Team and Project
Chargeback models require granular cost attribution. When the finance team asks why AI spending increased 40% last quarter, you need answers beyond "more usage."
Effective platforms provide:
- Usage dashboards filterable by team, project, and time range
- Cost trends with anomaly detection
- Comparative analysis across similar use cases
- Export capabilities for financial reporting systems
Bridging the Gap: How MintMCP Delivers Full Lifecycle AI Observability
MintMCP bridges the gap between AI assistants like Claude and ChatGPT with internal data and tools. The platform handles authentication, permissions, audit trails, and the complexity of enterprise deployments while maintaining ease of use for non-technical teams.
MCP Gateway capabilities for observability:
- One-click deployment of STDIO-based MCP servers with built-in hosting
- OAuth protection added automatically to any local MCP server
- Real-time dashboards for server health, usage patterns, and security alerts
- Complete audit trails that support SOC 2, GDPR, and regulatory audit requirements
- Enterprise-grade reliability and operational controls
LLM Proxy capabilities for monitoring:
- Tool call tracking across all coding agents
- Complete MCP inventory with permission visibility
- Security guardrails blocking dangerous commands in real-time
- Sensitive file protection for credentials and configuration
- Command history providing complete audit trails
Deploy in Minutes, Not Days
Implementation complexity often stalls observability initiatives. Organizations implementing observability during development rather than post-failure achieve faster iteration cycles and higher success rates.
MintMCP transforms local MCP servers into production-ready services with monitoring, logging, and compliance in a single step. The quickstart guide helps teams start implementing monitoring and governance without a large infrastructure buildout.
From Local MCP to Enterprise Deployment—Fast
The progression from developer experimentation to enterprise deployment should not require architectural overhaul. MintMCP's approach enables teams to start with hosted connectors for Snowflake, Elasticsearch, or Gmail, then scale to comprehensive governance as usage expands—all without changing developer workflows.
This graduated approach reduces implementation risk while ensuring observability infrastructure grows alongside AI adoption.
Implementing MintMCP: Your Path to Production-Ready AI Observability
Getting AI observability right from the start represents a strategic advantage as 42% of companies abandon most of their AI initiatives before production. MintMCP provides enterprise teams with the visibility, governance, and security infrastructure required to deploy AI agents at scale.
Why teams choose MintMCP for AI observability:
Comprehensive visibility without complexity: MintMCP delivers end-to-end observability across all MCP connections through a single platform. Real-time dashboards surface usage patterns, security anomalies, and performance metrics without requiring custom instrumentation or complex integration work.
Security and governance built in: With SOC 2 Type II attestation and OAuth-based authentication, MintMCP provides enterprise-grade controls from day one. Granular RBAC, automated policy enforcement, and complete audit trails meet regulatory requirements while enabling teams to move quickly.
Unified monitoring across all AI tools: Whether your teams use Claude Desktop, Cursor, ChatGPT, or custom agents, MintMCP provides consistent monitoring and governance. Complete MCP inventory visibility prevents shadow AI while enabling sanctioned tool adoption.
Cost control and attribution: Track token usage and API spend by team, project, and use case. Budget alerts prevent cost overruns while detailed analytics identify optimization opportunities across your AI infrastructure.
Faster path to production: MintMCP's quickstart enables teams to deploy hosted MCP servers with built-in observability in a single step. Transform local development environments into production services without rewriting code or changing workflows.
The platform scales with your AI adoption—start with a few connectors, add governance controls as usage grows, and maintain complete visibility across your entire AI infrastructure. Ready to implement production-ready AI observability? Explore MintMCP's platform or start with the documentation.
Frequently Asked Questions
What is the typical setup time for implementing AI agent observability?
Setup complexity varies significantly by approach. Gateway-based solutions like lightweight proxies can often begin capturing traces quickly with minimal code changes. Comprehensive platforms with evaluation suites and custom dashboards require more setup and tuning. Enterprise deployments spanning multiple agent systems and integration with existing identity management take longer and should be rolled out in phases. Start with basic tracing, then layer additional capabilities incrementally rather than attempting comprehensive observability in a single deployment.
How does observability help with AI agent compliance in regulated industries?
Regulatory frameworks increasingly require auditability for AI decision-making. EU AI Act Article 61 mandates continuous monitoring of high-risk AI systems. SR 11-7 in financial services requires validation and ongoing performance monitoring for models. ISO/IEC 42001 demands traceability throughout the AI lifecycle. Observability platforms meet these requirements by maintaining immutable audit logs of every agent decision, enabling post-hoc reconstruction of reasoning chains for regulatory review. Organizations in healthcare, finance, and other regulated sectors should ensure their observability platform provides tamper-evident logs and supports data retention policies aligned with their compliance obligations.
Can I implement observability for agents using multiple LLM providers simultaneously?
Yes—modern observability platforms support multi-provider deployments through standardized instrumentation. OpenTelemetry-based platforms can ingest traces from any LLM provider (OpenAI, Anthropic, AWS Bedrock, Azure OpenAI) through consistent semantic conventions. This enables unified visibility across hybrid deployments where different use cases route to different models. The key requirement is ensuring your instrumentation layer captures provider-agnostic metadata (tokens used, latency, cost) alongside provider-specific details. MintMCP's architecture supports this through its proxy layer, which provides consistent monitoring regardless of which underlying model serves the request.
What metrics should I prioritize when starting AI agent monitoring?
Begin with four foundational metrics before expanding to comprehensive observability. First, track error rates by distinguishing between technical failures (timeouts, API errors) and quality failures (hallucinations, incorrect outputs)—this requires at minimum a basic quality evaluation layer. Second, monitor latency distributions rather than averages, as agent response times vary significantly based on tool invocations and context length. Third, implement cost tracking per user and use case to establish baselines before optimization. Fourth, measure tool call success rates to identify unreliable integrations. Once these fundamentals are stable, add session-level quality scoring, drift detection, and comparative evaluation across model versions.
How do I convince leadership to invest in observability before production issues occur?
Frame the investment in terms of risk mitigation and velocity. Research indicates that adding observability post-launch requires re-instrumenting production code under time pressure, typically costing 3-5x more than implementing during development. The 42% of AI initiatives abandoned before production represent sunk costs in development, training data, and organizational change management. Present a phased approach: basic tracing in development (minimal cost, maximum learning), quality evaluation before production launch (prevents most post-deployment failures), and comprehensive dashboards for scaled operations (enables optimization). Budget 15-20% of AI development time for observability setup from sprint one rather than treating it as a post-launch addition.