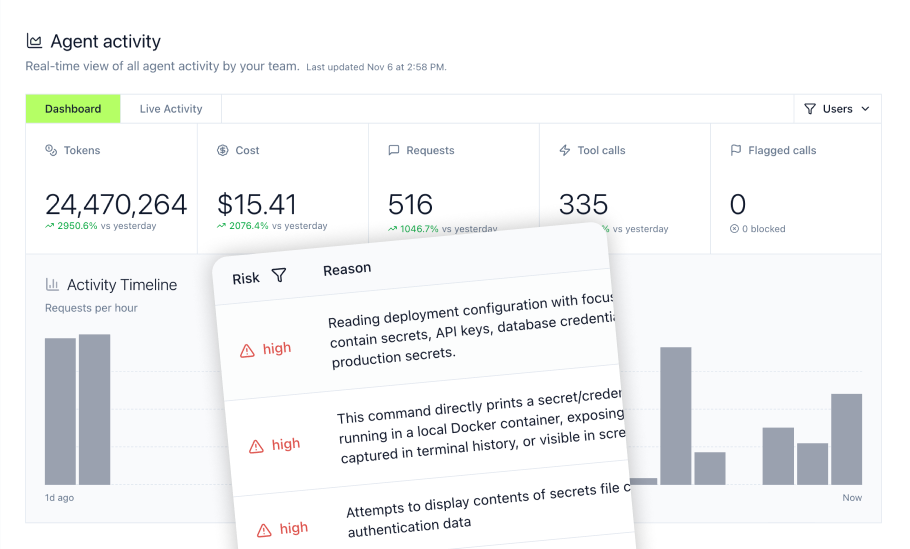
Your AI agents just consumed $50,000 in tokens this month. Can you explain where that money went to your CFO? Without proper agent monitoring, most organizations cannot answer that question. As enterprises deploy autonomous agents across customer service, development workflows, and data analysis, the gap between "we have AI agents" and "we understand what our AI agents are doing" creates real financial and operational risk. The solution requires visibility into token consumption, cost attribution per workflow, quality evaluation at scale, and security monitoring that catches risky behaviors before they reach production data.
Key Takeaways
- AI agents consume 5-30x more tokens than traditional chatbots, making token tracking essential for cost control
- Uber rapidly expanded Claude Code adoption and exhausted its annual Claude Code budget by spring 2026, highlighting how quickly agentic coding costs can outpace forecasts
- Keeping reusable prompt prefixes stable can improve cache hit rates and reduce input-token costs, with savings depending on the model provider and workload
- Customer-service AI can reduce cost per resolved interaction, but benchmarks vary substantially by workload, escalation rate, and resolution methodology
- Per-agent cost attribution can surface retrieval faults, oversized context, and retry loops that drive unnecessary spend
- Automated evaluation can continuously surface hallucinations and other quality regressions across production interactions
- Survey-based CSAT samples only respondents, while automated quality evaluation can score a much larger share of production interactions when configured to do so
Understanding the Need for AI Agent Monitoring in 2026
The AI agent ecosystem has moved far beyond simple chatbots. Modern agents make autonomous decisions, execute multi-step workflows, access production databases, and interact with external APIs. This shift creates a governance challenge that traditional application monitoring cannot address.
The Evolving Landscape of AI Agents and Enterprise Use Cases
Enterprise AI adoption has accelerated across every function:
- Development workflows: AI coding assistants like Claude Code and Cursor now handle code generation, debugging, and documentation
- Customer service: Autonomous agents resolve tickets, access CRM systems, and escalate complex issues
- Data analysis: Agents query databases, generate reports, and surface insights without human intervention
- Internal operations: Scheduling, expense processing, and compliance checking run on agent-driven automation
Each use case introduces unique monitoring requirements. A development agent burning through tokens on repeated compilation attempts creates different risk than a customer service agent accessing sensitive customer data without proper authorization.
Why Traditional Monitoring Falls Short for AI-Driven Workflows
Standard application performance monitoring tracks CPU utilization, memory consumption, and HTTP response codes. These metrics tell you almost nothing about AI agent behavior:
- Token consumption varies by task complexity: A simple query might use 500 tokens while a complex analysis uses 50,000
- Cost attribution requires semantic understanding: You need to know which workflow consumed tokens, not just that tokens were consumed
- Quality cannot be measured by uptime: An agent running 99.99% uptime while hallucinating answers is worse than one with occasional downtime
- Security risks emerge from agent decisions: Traditional security monitors network traffic, not whether an agent decided to access data it should not have
The result is a visibility gap where organizations know they are spending money on AI but cannot explain why, where, or whether the spend produces value.
Tracking Token Usage: Best Practices for LLM Observability
Token tracking forms the foundation of AI agent monitoring. Without accurate token metrics, cost attribution becomes impossible and optimization efforts target the wrong areas.
Granular Token Metrics and Their Business Implications
Effective token tracking requires granularity beyond monthly totals. The metrics that matter:
- Input vs. output tokens: Input tokens (context, prompts, system instructions) often dwarf output tokens. Identify whether bloated context or verbose responses drive costs
- Tokens per task type: Segment by workflow to find which operations consume disproportionate resources
- Tokens per user/team: Attribute consumption to business units for chargeback and budgeting
- Tokens per agent: When multiple agents run independently, track each agent's consumption separately
- Cache hit rate: Prompt caching reduces costs dramatically, but only if structured correctly
Granular token tracking can reveal whether retrieval configuration faults, oversized documents, repeated context, or retry loops are driving disproportionate inference costs.
Strategies for Optimizing Token Efficiency Across Agent Workflows
Token optimization starts with understanding where tokens go:
Prompt structure matters more than prompt length. Static content (system prompts, tool definitions, few-shot examples) should appear at the beginning of prompts. Dynamic content (user queries, session state, timestamps) should appear at the end. This structure can improve prompt-cache hit rates and reduce repeated input-token costs, with the actual savings depending on provider pricing and workload characteristics. Timestamps or other frequently changing content placed in reusable prompt prefixes can invalidate cache entries and reduce potential savings.
Context window management prevents runaway costs. Agents that retrieve large documents for every query accumulate unnecessary token spend. Implement:
- Chunking strategies that pull relevant sections, not entire documents
- Summarization layers that compress historical context
- Sliding window approaches that drop old conversation turns
Retry loops multiply costs silently. An agent that retries failed tool calls three times consumes triple the tokens. Implement circuit breakers that escalate to human review after two failures rather than retrying indefinitely.
Controlling AI Agent Costs: Strategies for Budget Optimization
Cost control requires more than tracking. It demands proactive limits, attribution, and alerting before budgets spiral.
Implementing Cost Controls for Multi-Model Deployments
Organizations running multiple models (GPT-4 for complex reasoning, Claude for customer interactions, smaller models for classification) face compound complexity. Each model has different pricing, and routing decisions directly impact cost.
Token budgets per agent and workflow represent the most direct cost control. Set maximum token consumption for each workflow type:
- Customer service agents: 10,000 tokens per conversation maximum
- Code generation agents: 50,000 tokens per session maximum
- Data analysis agents: 100,000 tokens per report maximum
When agents approach limits, they should either complete their task with remaining tokens or escalate to human review. This approach helps reduce runaway spend like the budget pressure Uber reported after exhausting its annual Claude Code budget by spring 2026.
Model routing based on task complexity reduces costs without sacrificing quality. Simple classification tasks do not require frontier models. Reserve expensive models for tasks that genuinely need their capabilities.
Predictive Cost Analysis for AI Agent Operations
Reactive cost monitoring catches problems after they occur. Predictive analysis prevents them:
- Baseline establishment (4-6 weeks): Monitor consumption patterns before setting hard limits. Understand normal variation before defining abnormal
- Trend analysis: Identify gradual cost increases before they become budget crises. A 5% weekly increase compounds to 12x annual increase
- Anomaly detection: Flag sudden consumption spikes immediately. A single misconfigured agent can consume a month's budget in hours
- Capacity planning: Project costs based on planned agent deployments and usage growth
AI cost forecasting remains difficult because agent workloads can vary sharply in token consumption, retry behavior, context size, and usage volume. Predictive analysis helps teams identify these changes before they become budget surprises.
Measuring AI Agent Performance: Key Metrics Beyond Uptime
Performance monitoring for AI agents requires metrics that capture quality, not just availability. An agent that responds quickly with wrong answers performs worse than one that takes longer to provide correct responses.
Defining Performance Benchmarks for Agentic Workflows
The metrics that matter for AI agent performance:
Resolution rate measures whether agents actually solve problems. However, definitions vary wildly across vendors. Clarify whether "resolution" means:
- AI assessed the conversation as resolved
- Customer confirmed resolution
- No follow-up within X days
- Includes deflections to self-service content
Reported AI agent resolution rates vary widely by product and methodology, so the number means little without understanding how "resolution" is defined.
Reopen rate catches containment disguised as resolution. High resolution combined with high reopen indicates agents are closing conversations prematurely rather than actually helping customers.
Task completion success applies to workflow agents. Did the code generation agent produce working code? Did the data analysis agent return accurate results? Did the scheduling agent book the correct meeting?
Response latency matters for user-facing agents but must be balanced against quality. Sub-second responses that hallucinate are worse than two-second responses that are accurate.
Leveraging APM Principles for AI Agent Evaluation
Traditional APM concepts translate to AI monitoring with adaptation:
- Distributed tracing captures multi-step agent workflows. Sessions contain traces, traces contain spans, spans contain individual tool calls. This hierarchy reveals where agents spend time and tokens
- Error categorization distinguishes between infrastructure failures (network timeouts, API rate limits) and agent failures (hallucinations, incorrect tool usage, policy violations)
- Service level objectives define acceptable performance thresholds. Example: 95% of customer service conversations resolve within 5 minutes with less than 2% hallucination rate
Implementing Advanced AI Monitoring with Application Performance Management (APM)
APM platforms provide infrastructure for collecting, storing, and analyzing monitoring data. Integrating AI agent metrics into existing APM workflows reduces operational overhead.
Integrating AI Agent Metrics into Existing APM Solutions
Three integration approaches exist, each with different tradeoffs:
AI Gateway integration (often the fastest setup) routes all LLM API calls through a proxy that automatically logs requests, responses, tokens, and latency. Change your API base URL from the model provider to the gateway URL. Instant visibility with minimal code changes.
SDK integration (deeper application-level instrumentation) instruments agent code with tracing decorators or wrappers. More setup time but provides deeper visibility into agent reasoning, tool selection, and intermediate steps.
OpenTelemetry integration (standards-based observability integration) sends spans to your existing observability stack using industry-standard protocols. Requires coordination with platform teams but ensures consistency with existing monitoring infrastructure.
Building Custom Dashboards for Comprehensive AI Observability
Effective dashboards answer specific questions:
Executive dashboard: Total spend, spend by business unit, cost trend, ROI indicators. Update daily.
Operations dashboard: Active agents, error rates, latency percentiles, queue depths. Real-time.
Security dashboard: Policy violations, data access patterns, anomalous behaviors. Real-time with alerting.
Quality dashboard: Resolution rates, hallucination rates, customer satisfaction proxies. Daily aggregation with weekly trends.
Export agent logs to your existing SIEM platform (Splunk, Microsoft Sentinel) for correlation with security events and long-term retention. The security governance layer should connect monitoring data to compliance requirements.
Securing AI Agents: Monitoring for Risks and Compliance
Security monitoring for AI agents addresses threats that traditional security tools miss. Agents make decisions about data access, and those decisions need oversight.
Real-time Threat Detection in AI Agent Interactions
Critical security events to monitor:
- PII exposure: Agents accessing or returning personally identifiable information without authorization
- Credential leakage: API keys, tokens, or passwords appearing in agent inputs or outputs
- Prompt injection attempts: Malicious inputs designed to manipulate agent behavior
- Risky command execution: Agents running bash commands, file operations, or database modifications that could cause damage
- Data exfiltration patterns: Unusual volumes of data being accessed or returned
When agents attempt risky behaviors, monitoring should enable immediate response. Blocking prevents damage. Alerting enables investigation. Logging creates audit trails for compliance.
Ensuring Regulatory Compliance with Agent Activity Logging
Depending on the applicable framework, industry, data type, and AI system classification, organizations may need audit records that support access review, incident investigation, accountability, and regulatory evidence. Effective agent activity logging can include:
- Relevant interaction context: Prompts, tool calls, responses, policy decisions, and available execution metadata
- User attribution: Which human initiated the agent session
- Timestamp accuracy: Precise timing for forensic investigation
- Immutability: Logs that cannot be altered after creation
- Retention policies: Logs kept for required compliance periods
For organizations handling protected health information, HIPAA compliance requires additional controls around data access logging and breach notification procedures.
Leveraging AI Observability Tools for Deeper Insights
Beyond basic metrics, observability tools provide analytical capabilities that transform raw data into actionable intelligence.
From Raw Logs to Actionable Intelligence with LLM Observability
Modern observability platforms offer:
Automated evaluation using LLM-as-judge approaches. Instead of manually reviewing conversations, use a model to assess quality at scale. Automated evaluation can provide broader coverage than survey-based CSAT by scoring production interactions without requiring customers to submit feedback.
Anomaly detection surfaces unusual patterns automatically. Sudden changes in token consumption, error rates, or response patterns trigger alerts without manual threshold configuration.
Root cause analysis traces problems from symptoms to sources. When resolution rates drop, drill down through traces to identify whether the cause is retrieval quality, prompt issues, or model degradation.
Production to test case conversion turns real-world failures into regression tests. When an agent fails in production, capture the inputs and expected outputs to prevent recurrence.
The Role of AI in Automating Monitoring and Alerting
Self-healing monitoring systems use AI to reduce operational burden:
- Alert correlation groups related alerts to reduce noise. Ten alerts about the same underlying issue should generate one incident, not ten
- Predictive alerting warns before problems occur. If error rates trend upward, alert before they breach SLOs
- Automated remediation handles known issues without human intervention. Rate limit exceeded? Automatically back off and retry
The Role of Centralized AI Agent Governance in Monitoring
Scattered monitoring across multiple tools creates gaps and inconsistencies. Centralized governance provides unified visibility and control.
Streamlining AI Agent Deployments with Unified Governance Platforms
A centralized MCP gateway serves as the control plane for MCP-routed data and tool access:
- Centralized identity controls: SSO and SCIM govern human and team access, while agent identities use their own scoped credentials
- Unified access policies: Centralize organization and team policies while retaining per-Bundle and per-agent scoping where needed
- Consolidated audit logs: Centralize MCP-routed activity, while Agent Monitor extends visibility to supported local and off-gateway agent activity
- Consistent credential management: Rotate credentials centrally rather than updating each agent individually
Ensuring Consistency and Security Across Diverse Agent Ecosystems
Organizations running agents across Claude, Cursor, ChatGPT, Gemini, and Copilot face fragmentation. Each tool has different logging formats, access controls, and monitoring capabilities.
Centralized governance normalizes this diversity:
- Protocol normalization: stdio and Streamable HTTP are the current standard MCP transports, while legacy HTTP+SSE can be supported for backward compatibility. The gateway provides consistent authentication and logging across governed connections
- Credential brokering: OAuth brokering helps normalize authentication across supported MCP connections, including hosted and stdio servers
- Policy inheritance: Organization policies cascade to teams, teams to individual agents
- Shadow AI detection: Identify agents running outside governed channels. If engineers deploy unauthorized MCP servers, detect and address the gap before it becomes a security incident
Building a Robust AI Agent Monitoring Stack (MLOps Platform)
Monitoring exists within a broader operational context. Integrating monitoring into MLOps workflows ensures continuous improvement rather than reactive firefighting.
Integrating Monitoring into the MLOps Lifecycle
Effective integration touches every stage:
Development: Local tracing during agent development catches issues before deployment. Developers should see token consumption and latency for their changes before committing.
Testing: Automated evaluation in CI/CD pipelines prevents regressions. If a change increases hallucination rate or token consumption beyond thresholds, fail the build.
Deployment: Canary releases compare new agent versions against baselines. Route 5% of traffic to the new version and monitor quality metrics before full rollout.
Production: Continuous monitoring with alerting catches degradation. When external factors change (model updates, data drift), detect impact immediately.
Feedback: Production failures feed back into test suites. Every incident should result in a test case that prevents recurrence.
Architecting for Scalable and Maintainable AI Agent Operations
Long-term maintainability requires architectural discipline:
- Infrastructure as code: Define monitoring configuration, dashboards, and alerts in version-controlled code. Changes go through review and can be rolled back
- API-first design: REST APIs and SDKs enable programmatic management. Automate routine operations rather than clicking through UIs
- Modular architecture: Swap components as the ecosystem evolves. Today's best tracing platform may not be tomorrow's best
- Cost-aware scaling: Monitoring itself consumes resources. Sampling strategies, retention policies, and aggregation reduce overhead while preserving insight
How MintMCP Enables Enterprise-Grade AI Agent Monitoring
MintMCP provides the governance layer that makes comprehensive AI agent monitoring practical at enterprise scale. Rather than stitching together point solutions, MintMCP delivers unified visibility and control through two connected layers: MCP Gateway for governed data and tool connections across the AI systems users already run, and Agent Gateway for identities, permissions, memory, and monitoring for the agents that work alongside your teams.
MCP Gateway for Governed Data Access
The MintMCP Gateway centralizes MCP server management across Claude, Cursor, ChatGPT, Gemini, and Copilot with:
- Full conversation-level logging: Every prompt, tool call, response, and context captured with per-user attribution
- Configurable retention and export: Send logs to Sentinel, Splunk, or S3 for long-term analysis and compliance
- Rate limiting and quotas: Apply gateway-level rate controls to MCP traffic while Agent Monitor tracks token usage and estimated cost across users, agents, models, and sessions
- Tool-level access control: Enable database reads while blocking writes, or allow specific MCP servers while restricting others
Agent Gateway for Agent Identity, Permissions, Memory, and Monitoring
Building on the MCP Gateway foundation, MintMCP's Agent Gateway provides the control layer for agents that operate alongside your team:
Agent Monitor tracks agent activity across your organization, including:
- Shadow AI detection: Identify MCP usage in Cursor and Claude Code that bypasses the gateway
- PII and credential detection: Flag sensitive data exposure in real-time with block or alert actions
- Risky behavior identification: Catch dangerous bash commands, prompt injection attempts, and policy violations
- Usage analytics by team and tool: Understand adoption patterns, latency trends, and error rates across the organization
Agent Bundles give each AI agent its own identity with:
- Scoped credentials: Each agent receives its own rotatable credentials, independent of user access
- Per-agent policy: Define what tools each agent can access and what actions it can take
- Isolated audit trails: Track what each agent does separately for attribution and compliance
- M2M authentication: OAuth 2.0 client-credentials flow for agent-to-system communication
Enterprise-Ready Security and Compliance
MintMCP is SOC 2 Type II audited, compliant with HIPAA standards, and penetration tested. Data encryption in transit and at rest, data residency options, and uptime SLAs provide the foundation enterprises require.
Custom gateway middleware runs in a JS sandbox with built-in templates for AWS Bedrock Guardrails, jailbreak detection, and PII masking. Integrate your existing DLP investments (Microsoft Purview, Nightfall, Skyflow) inline at the gateway.
For organizations serious about AI agent governance, MintMCP combines MCP Gateway for governed data and tool connections with Agent Gateway for agent identities, permissions, memory, and monitoring. Visit the Trust Center for complete security documentation.
Frequently Asked Questions
What are the key metrics to monitor for AI agent performance?
Focus on metrics that capture quality, not just availability. Resolution rate measures whether agents solve problems, but clarify how "resolution" is defined (AI-assessed vs. customer-confirmed). Reopen rate catches agents closing conversations prematurely. Task completion success measures whether workflow agents produce correct outputs. Response latency matters but must be balanced against quality. Hallucination rate tracks factual accuracy. Token consumption per task reveals efficiency. Error categorization distinguishes infrastructure failures from agent decision failures. The specific weights depend on your use case: customer-facing agents prioritize resolution and satisfaction, while internal workflow agents prioritize task completion accuracy.
How can I effectively track and reduce token usage for my AI agents?
Start with granular attribution: track tokens per agent, per workflow, per user, and per task type. Identify where consumption concentrates before optimizing. Structure prompts with static content (system instructions, tool definitions) at the beginning and dynamic content (user queries, session state) at the end to improve cache hit rates. Implement chunking strategies that retrieve relevant document sections rather than entire documents. Set per-agent and per-workflow token budgets with circuit breakers that escalate to human review rather than retrying indefinitely. Monitor cache hit rates to ensure prompt structure actually enables caching.
What is shadow AI and how can I detect it in my organization?
Shadow AI refers to AI agents and MCP servers deployed outside governed channels. Engineers might install MCP servers locally in Cursor or Claude Code without routing through corporate authentication and logging. This creates security gaps (no audit trail), compliance risk (no data access controls), and cost blind spots (unknown token consumption). Detection requires monitoring at the endpoint level, not just the gateway. Hook into developer tools to identify MCP usage patterns that bypass the gateway. MDM integration enables push of detection configurations to developer machines. Once identified, address shadow AI through policy enforcement or by making the governed path easier than the ungoverned path.
How does AI agent monitoring differ from traditional application monitoring?
Traditional APM tracks infrastructure metrics: CPU, memory, network latency, HTTP response codes, and uptime. These metrics tell you nothing about AI agent behavior. Agent monitoring requires semantic understanding: what task did the agent attempt, what tokens did it consume, what quality did it achieve, what data did it access, and what decisions did it make. Token attribution replaces request counting. Quality evaluation replaces simple error rates. Data access logging replaces network traffic analysis. Decision tracing replaces stack traces. The infrastructure may be healthy while the agent produces wrong answers, accesses unauthorized data, or burns through budget on retry loops.
What role does centralized governance play in AI agent observability?
Centralized governance transforms scattered monitoring into unified visibility. Without it, each AI tool (Claude, Cursor, ChatGPT, Gemini, Copilot) has different logging formats, access controls, and monitoring capabilities. Security teams must check multiple systems to understand what agents accessed. Cost attribution requires manual aggregation across platforms. Policy enforcement must be replicated in each tool. A centralized governance layer combines gateway controls with agent monitoring to normalize this diversity through centralized authentication, access policies, audit logs, and credential management. When regulations require proof of agent activity, this unified visibility reduces the need for forensic investigation across separate AI tools.